Identification of Topics and Their Evolution in Management Science: Replicating and Extending an Expert Analysis Using Semi-Automated Methods
(This article is a digital replication of a thesis submitted to the Faculty of Graduate and Postdoctoral Affairs in partial fulfillment of the requirements for the degree of Master of Applied Science In Technology Innovation Management Carleton University Ottawa, Ontario. A PDF version is available here.)
Abstract: Latent Dirichlet allocation (LDA) is a popular generative probabilistic model that enables researchers to analyze large semantic datasets; however, few open-source software tools with Graphical User Interfaces (GUIs) are available to researchers. This study identifies an open-source software tool that, in conjunction with a popular electronic spreadsheet software application, can be used to perform topic modeling. A process is developed and evaluated against a pre-existing expert review that examines work published in Management Science on the topics of technological innovation, product development, and entrepreneurship between 1954 and 2004 (Shane and Ulrich, 2004). The process is then replicated using an expanded corpus that includes all articles published in Management Science between 2005 and 2015. The discussion includes an analysis of the process and insights generated by using topic modeling. A replicable process for researchers and suggestions for practitioners are provided.
- Introduction
- Literature Review
- Research Design
- Management Science (1954-2004)
- Management Science (2005-2015)
- Discussion
- Conclusion
- References
Introduction
As part of the 50th anniversary celebrations for Management Science, a review of all articles related to technological innovation, product development, and entrepreneurship that had been published between 1954 and 2004 was conducted by then-editors Shane and Ulrich. This expert review, published in 2004, helped identify 12 themes and their evolution during the period. The results provided insights for researchers in terms of understanding what questions have been addressed in Management Science in the area of innovation and how knowledge developed over a half-century (Shane and Ulrich, 2004).
In the years since, a number of semi-automated methods have evolved that allow researchers to perform similar analytical tasks in a shorter period of time. In particular, the algorithm proposed by Blei al. (2003) – Latent Dirichlet Allocation (LDA) – is a popular topic modeling technique; however, its use outside of computer science remains infrequent, possibly due to the lack of a Graphical User Interface (GUI) on most topic modeling tools. Research comparing semi-automated methods to human-generated results in pre-planned experiments exists; however, few studies compare the results of topic modeling to an expert review that was completed before the semi-automated methods gained popularity outside of computer science and none have done so using topic modeling software with a GUI.
In this study, we review the work performed by Shane and Ulrich (2004) and reproduce it using the selected semi-automated method (topic modeling). A process is developed using a relatively new open-source topic modeling tool (Orange) and the similarities and differences in the output between the expert review and the topic modeling tool are documented. The new process is then used to review an additional ten years of articles published in Management Science (2005-2015). Researchers interested in the use of semi-automated methods – as well as those interested in trends that present themselves in Management Science – would benefit from reviewing this work.
Objective
The objective of this research is to replicate and extend an expert review using select semi-automated methods. Specifically, the objective was to develop a replicable, semi-automated process for topic modeling using open-source software and identify how the results of this process compare to an expert review. This process would then be applied to a new corpus.
Deliverables
This thesis has four (4) deliverables:
⦁ New insights into the evolution of topics in the Management Science journal within both the original corpus (1954-2004) and a new corpus (2005-2015).
⦁ A comparison of how the results of the semi-automated methods were similar and/or different from the results produced by expert editors.
⦁ Recommendations for research practice, including instructions for other researchers to replicate semi-automated expert reviews using the selected software.
⦁ Recommendations for improvements to the selected open-source software, to expedite the analysis process.
Contribution
This research makes two types of contributions, contributions to the general body of scholarship and contributions to practice.
Contributions to scholarship
This research contributes to scholarly knowledge by:
⦁ Identifying advantages and limitations of using selected semi-automated methods and topic modeling tools, as compared to the baseline of a manual expert review.
⦁ Providing insights about the evolution of topics within a pre-existing corpus from Management Science (Shane and Ulrich, 2004) as well as within an expanded corpus from the same journal.
Contribution to practice
This research contributes towards practice by:
⦁ Creating instructions for the use of selected tool(s) for achieving specific topic modeling objectives for other researchers.
⦁ Identifying manual steps that could be eliminated by the software tool developers.
Relevance
The deliverables of this research will be of relevance to the following groups: (1) Researchers, (2) Executives and Top Management Teams, and (3) Practitioners & Software Developers.
First, researchers that have access to large semantic data sets will be interested in reviewing this work. As large electronic document archives become readily available online and widely accessed by diverse communities, new tools for automatically organizing, searching, indexing and browsing large collections are required (Blei & Lafferty, 2006; 2007). Further, an understanding of the similarities and differences between the results generated by manual and semi-automated methods, along with the open-source tools available to perform similar tasks will assist researchers in determining if these tools are suitable for reviewing their semantic datasets.
Second, the time available for an individual to collect, read, interpret, and act is limited in both corporate and research environments (Uys, Schutte & Van Zyl, 2011). Businesses may have large corpora that the process and tools could be used to analyze (e.g. market analysis research). Executives and top management teams will be interested in both (a) the ability to analyze large corpora using these tools, as well as (b) the additional insights generated regarding the content of Management Science using semi-automated methods within both the original corpus as well as an expanded 10-year period.
Third, practitioners will benefit through understanding how current topic modeling tools are used, while software developers will benefit from understanding where there are unnecessary manual steps that can be removed.
Organization of the document
This research is organized into seven (7) chapters, each with subsections. The literature review (Chapter 2) provides insight regarding current methods described in current literature. The research design and method section (Chapter 3) outlines the actions required to produce the deliverables. Chapter 4 details the results generated by reviewing Corpus A and outlines the proposed topic modeling process, which is validated in the discussion section. These results validated in Chapter 5 when it is applied to a larger corpus. Chapter 6 provides an analysis of the results of this research. Chapter 7 concludes the study identifying research limitations and suggestions for future research.
Literature Review
To inform and guide this literature review, we examined the objectives outlined in Technological Innovation, Product Development, and Entrepreneurship in Management Science (Shane and Ulrich, 2004):
First, we hope that it will be useful to doctoral students and researchers interested in understanding what questions have been addressed in Management Science in the area of innovation. Second, we hope that the article will be useful to sociologists of science who are interested in understanding how knowledge develops in a field (p. 33).
These goals can be summarized as (1) identifying pre-existing topics on a given subject within a journal (i.e., “what questions have been addressed”), and (2) identifying how these topics have evolved (i.e., “how knowledge develops in a field”).
It was determined that a literature review should include information on semi-automated methods (specifically, topic modeling) and a summary of similar studies that use topic modeling to examine academic journals. This literature review provides a baseline of knowledge for reviewing the two datasets and generating labels for the topics in the topic models.
Topic Modeling
In domains such as sociology, there are three main ways to analyze texts: (1) virtuoso interpretations based on insights the readings produce, (2) produce a set of themes (based on research questions theoretical priors, or perusal of a subset of texts) and generate a coding sheet, then code the texts by reading them, or (3) search texts for keywords (based on research questions or theoretical priors) and comparing subsets of texts with respect to the prevalence of those keywords (DiMaggio, Nag, & Blei, 2013). These approaches require the researcher to generate meaning early in the review process. Further, it has been inferred that human coding of documents could be biased by properties of the documents themselves such as form, organization, and style (Radar & Wash, 2015).
DiMaggio et al. (2013) argue that a sound approach to text analysis must satisfy four conditions: explicit (for reproducibility, testing interpretations), automated (to accommodate the large volumes of text available), inductive (to permit the researcher to discover the structure of the corpus before imposing their priors on the analysis), and it must recognize the relationality of meaning by treating terms as varying in meaning across different contexts. It is their position that topic modeling satisfies each of these conditions (DiMaggio et al., 2013).
Topic modeling algorithms are a suite of machine learning methods that facilitate the unveiling of hidden thematic structures from large textual collections (Blei, Ng, and Jordan, 2003; Chang, 2016; DiMaggio et al., 2013; Song and Ding, 2014). Topic models are based upon the idea that documents are mixtures of topics, where a topic is a probability distribution over words (Blei et al., 2003; Griffiths & Steyvers, 2002; 2003; 2004; Hofmann, 1999; 2001). A strength of topic modeling is its ability to capture polysemy by allowing a word to belong to different topics; the disambiguation of different uses of a term, based on the context in which it appears, allows for the same term to appear within different topics (Steyvers & Griffiths, 2007; DiMaggio et al., 2015). The emphasis on relationality (the belief that meanings emerge out of topics) is shared by both linguists and cultural sociologists: topics may be viewed as frames (“semantic contexts that prime particular associations or interpretations of a phenomenon in a reader”) or lenses for viewing a corpus of documents (DiMaggio et al., 2013).
There are several known limitations to topic modeling. These include the requirement for the researcher to make a series of judgements around choosing stop words and the number of topics produced. The decisions made by a researcher related to these points will impact the results. Additionally, large and complex datasets can consume a considerable amount of computer memory and require extensive processing time; however, each of these issues can be partially mitigated through careful structuring of the experiments and selection of topic modeling tools.
Topic models originated with latent semantic indexing (LSI), but that method is not considered to be an authentic topic model as it is not a probabilistic model.
Probabilistic latent semantic analysis (PLSA) was based on LSI (Hoffman, 2001). An extension of PLSA is Latent Dirichlet Allocation (LDA). While there are a growing number of probabilistic models that are based on LDA, the remainder of this section will focus on LDA.
Latent Dirichlet Allocation (LDA)
Proposed by Blei et al. (2003), LDA is “a 3-level hierarchical Bayesian model, in which each item of a collection is modeled as a finite mixture over an underlying set of topics. Each topic is, in turn, modeled as an infinite mixture over an underlying set of topic probabilities” (p. 994). It is a “bag of words” technique, whereby words are considered to be independent (i.e. word order is not relevant); however, the algorithm looks at the frequencies and co-occurrence of words within the document and in common across documents (Neuhaus & Zimmerman, 2010; Rader & Wash, 2015).
LDA makes some assumptions, including: each document delineates different proportions of the topics and that each topic can be summarized by a set of words (Blei, 2012; Radar & Wash, 2015). Put another way, the words in each document are all related to the underlying topics within that document (Radar, 2015); this assumption that documents exhibit multiple topics is particularly useful for addressing heteroglossia, or the copresense of competing “voices” (perspectives / styles of expression) within a single text (Blei, 2012; DiMaggio et al., 2013). LDA uses contextual clues to group related words and distinguish between uses of ambiguous words (polysemy) (Blei et al., 2003; Chang, 2016) and has been identified as catering for synonymy (Griffiths, Steyvers, & Tenenbaum, 2007). As with other topic models, an unsolved problem is that users must pre-specify the number of topics to identify, as the number of topics is assumed to be a known, fixed number (Neuhaus & Zimmerman, 2010; Rader & Wash, 2015). It is also important to note that LDA does not produce a definitive categorization for what each document is “about” or a quality assessment of the information within each document (Radar & Wash, 2015).
LDA has been used by researchers in a variety of fields, including history, political science, public policy, sociology, science and technology studies (Choi, Lee, & Sohn, 2017; DiMaggio et al., 2013; Jockers & Mimno, 2013; Koltsova & Koltcov, 2013; Rader & Wash, 2015). While the use of structured data is common,practitioners in emerging fields such as cybersecurity have used LDA to process unstructured data such as interpersonal stories, news articles, and web pages (Rader & Wash, 2015). More recently,it has been used
to examine conversations on Twitter (Alvarez-Melis & Saveski, 2016).LDA has been used to identify trends in journals as diverse as Computers and Industrial Engineering(Uys, Shutte, & Van Zyl, 2011) and the Journal of Economic History (Wehrheim, 2017).There are many multi-journal reviews using topic modeling, including: a review of the field of development studies using 26,685 articles from 30 journals with 15 years of data (Thelwall & Thelwall, 2016), a review of physics using 3,448 articles across five journals (Peskin & Dima, 2017), and a corpus of scientific abstracts containing 5,225 abstracts with 28,414 unique terms (Blei et al., 2003).
Topic Modeling Tools
There are several open-source software tools that have topic modeling as part of their functionality. These have previously been identified by other authors, including Amin (2016) and Tapelova (2017). The combined and redacted summary of these tools are as follows:
| Package | Developer | Features |
|---|---|---|
| MALLET | McCallum (2002) | Implements LDA using Gibbs Sampling |
| LDA-C | Blei (2003) | Implements LDA with Variational Sampling. |
| Matlab Topic Modeling Toolbox | Steyvers (2005) | Implements LDA with Gibbs Sampling. |
| Stanford Topic Modeling Toolbox (TMT) | Ramage (2001) | Implements LDA. Allows visualization of topics in Excel. No longer supported by original authors. |
| GENSIM | Rehurik & Sojka (2010) | Implements LSA, PLSA, and LDA using Gibbs sampling. |
| R package topic models | Hornik & Grun (2011) | Works well with other R packages for NLP such as tm and textmineR. Built in R, an r wrapper around LDA-C by Blei (2003). |
| R package LDA | Chang (2015) | Implements LDA using Collapsed Gibbs Sampling. Implements other LDA topic models such as Supervised LDA, Correlated LDA, and Relational LDA. Works well with other R packages for NLP such as tm and textmineR. |
Heuristics for Evaluating Topic Models
The selection of an appropriate topic model involves a variety of trade-offs and judgments by the human researcher (Evans, 2014); the selection of the model that is the best fit for the specific research question requires both qualitative and quantitative validation techniques (Griffiths et al., 2007). As noted above, one of the limitations of topic modeling is the requirement for the researcher to select the number of topics. Heuristics used to evaluate topic models and determine the best fit range from the use of statistical modeling through to manual Labeling of each topic, depending on the research question being posed. It is important to note that the commonly-used adage in statistics remains true: “all models are wrong, but some are useful” (Box & Draper, 1987: 424). The following is a summary of some of the heuristics discussed in the literature:
Compute metrics (log-likelihood, perplexity)
Metrics such as log-likelihood and perplexity have been proposed to assess the quality of a topic model and determine the best number of topics (Amin, 2016; Tapilova, 2017); however, it is important to note that these heuristics are often advocated by software engineers who are comfortable with programming languages. These metrics do not necessarily agree with human assessments; Neuhaus and Zimmerman (2010) observed that domain experts judged the best number of topics lower than what the max log-likelihood metric suggested. Further, computing these metrics is only available programmatically (using R or Python-based tools), not with more user-friendly tools.
Determine Overall Importance
Multiple authors suggest it is critical to determine the overall importance of topics within a model (Mathew et al., 2016; Neuhaus & Zimmerman, 2010). Mathew et al. (2016) suggest selecting the topics that explain 90% of the papers (i.e., excluding topics that are not included in the 90% threshold) based on the expectation that topics with higher weight are more straightforward to name since they have more supporting documents. Similarly, the order of topics and words within topics is important (Mathew et al., 2016). In practice, when reviewing a model this would mean the topics should be ordered top-to-bottom, most-to-least frequent and words within topics should be ordered left-to-right, most-to-least frequent. This helps ensure the researcher is reviewing those topics and words with the highest overall importance prior to those with lower overall importance.
Evaluate Coherence
The evaluation of topics within a model for coherence is another heuristic that may be used. In his talk, Mimno (2012) discusses how a researcher can examine how the words inside a topic relate to each other; specifically, he makes several observations about coherence including the identification of both topic and word intruders. This approach is reflected in the article Reading Tea Leaves: How Humans Interpret Topic Models, whereby the authors devised two human evaluation tasks to explicitly evaluate both the quality of the topics inferred by the model and how well the model assigns topics to documents:
⦁ The first, word intrusion, measures how semantically “cohesive” the topics inferred by a model are and tests whether topics correspond to natural groupings for humans.
⦁ The second, topic intrusion, measures how well a topic model’s decomposition of a document as a mixture of topics agrees with human associations of topics with a document (Chang, Gerrish, Wang, Boyd-graber, & Blei, 2009: 2).
As noted by Neuhaus and Zimmerman (2010), as the number of topics increases the topics will become more fragmented (less cohesive). This suggests that topics should be merged. Further, Neuhaus and Zimmerman (2010) suggest that an indicator that topics are not well separated is that there is a large overlap in the set of words that appear in different topics and that these topics should be combined.
Labeling Topics (Headwords, Word Clouds)
Topic labels are a means by which it is easier to refer to the topics than the automatically-generated labels:
Assigning labels to topic clusters is a subjective process. The labels I have assigned here are most frequently derived from the topic headwords. Some may find the labels unhelpful or even controversial. […] By default the modeling process assigns topics a number (e.g. topic 1, topic 2, etc.). While referring to topics by number is certainly less controversial, it’s not a very useful way to talk about them. These labels should be read as “general terms of convenience” and not as definitive statements on the ultimate meaning of the word cluster (Jockers, 2013, para 2).
Other authors suggest that it is valid to use the top terms to label the topics, as “there is very little information associated with the latter words. Hence, the evidence to hand suggests that generated labels from the first few terms [are] valid” (Mathew et al., 2016: 6). Examples from their work include:
⦁ Program analysis: program, analysis, dynamic, execution, code, java, static
⦁ Source code: code, source, information, tool, program, developers, patterns
⦁ Developer: developer, project, bug, work, open, team, tools
In short, topics with lower weights may not have many supporting documents and therefore the keywords may become more arbitrary. If it becomes difficult to generate a topic label, this can be an indicator there are too many topics.
Finally, as LDA can allocate the same term to multiple topics (due to polysemy), visualization of the terms can assist researchers in determining appropriate topic labels. Topic word clouds have been used as a heuristic by several authors, including Jockers (2013).
Summary
In summary, LDA is popular, and is used in a variety of research areas for examining large semantic datasets to identify latent topics. It is particularly useful for eliminating bias of manual coding. The inputs to the topic models are critical – the decisions around choosing stop words, the number of topics produced, and the scope of the corpus will influence the final results, introducing researcher bias.Different heuristics are available to researchers to help them identify the correct topic model for their situation.These are a mixture of qualitative and quantitative approaches, including: log-likelihood, perplexity, overall average topic weights, coherence, headwords and reviewing word clouds. Topic models are a lens for viewing the corpus; selection should be based on whether substantively meaningful and analytically useful topics are identified.
Research Design
Approach
Text analysis methods can be divided into two groups: deductive methods that are based on a pre-defined codebook with a set of relevant categories, and inductive methods that share an explorative character aiming to identify certain attributes of the text content (Gunther & Quandt, 2016). An inductive approach is helpful for generating initial information regarding the text corpus when researchers have little prior knowledge about its content, offering a way to subset the data by identifying relevant documents for a following (manual) in-depth analysis and generally reducing the manual workload (Gunther & Quandt, 2016). This research uses and inductive approach as it is explorative, aiming to identify certain attributes of the text content by a non-expert (i.e., a graduate student).
Table 3-1 identifies the steps carried out in this research. The subsections detail the steps taken to generate the results and deliverables of this research. These steps are adapted from Amin (2016) and Tapelova (2017); however, modifications have been made for clarity and to account for (a) multiple corpora and (b) an analysis of the process and tools.
| Step | Description | Activity |
|---|---|---|
| i | Literature Review | Identify and define key characteristics of topic modeling that will allow the researcher to identify topic modeling tools and heuristics. |
| ii | Select Topic Modeling Tools | Selection of tools and methods suitable for replicating and extending the expert topic review based on the literature review. |
| iii | Acquire Data | Obtain copies of Management Science articles published from 1954-2004 previously identified by Shane and Ulrich’s review (2004) (“Corpus A”) and extract titles, abstracts and publication dates. |
| iv | Preprocess & Process Data | Preprocessing data (stop words, normalization) and create models for different number of topics using selected implementation of topic modeling algorithm (LDA in Orange) |
| v | Select & Interpret Topic Model | Evaluate the models based on selected heuristics. Identify the model with the optimal number of topics for this study. Begin interpretation of model through Labeling of topics. |
| vi | Analyze the Model | Generate charts detailing the number of publications published per year per topic, as well as the distribution of topics over time. Review topic evolution and discuss interesting trends. |
| vii | Compare Results | Compare results of final categorization and tables to Shane and Ulrich (2004). |
| viii | Extend Analysis | Apply the process (steps iii-vi) to a larger corpus (“Corpus B”: all articles published in Management Science from 2005-2015). Demonstrate how the process works on a larger corpus that could not be processed manually. |
| ix | Summarize Process | Generate summary of replicable process for generating topic models based on insights generated. |
Research Design
Unit of Analysis & Study Period
The unit of analysis for this study is two corpora, both generated from articles published in the Management Science journal. These consist of:
⦁ Selected article and title abstracts from an expert review. The articles – which had been identified by Shane and Ulrich (2004) as being related to the topics of technological innovation, product development, and entrepreneurship – span a period from 1954 to 2004. This will be identified as “Corpus A.”
⦁ All article titles and abstracts published spanning a ten-year period from 2005 to 2015. This will be identified as “Corpus B.”
Only using article titles and abstracts in relation to academic articles (rather than the entire text of the papers) when generating a topic model simplifies data collection. Mathew et al. (2016) summarize their reasons for using a similar dataset as follows:
(a) Titles and abstracts are designed to index and summarize papers; (b) Obtaining papers is a huge challenge due to copyright violations and its limited open source access; (c) Papers contain too much text which makes it harder to summarize the content. Abstracts on the other hand are much more succinct and generate better topics (p. 5).
Shane and Ulrich (2004) also used titles and abstracts to help narrow the articles for review in their initial data preprocessing steps; as such, using the titles and abstracts ensures this process is similar to that of the selected expert review.
Sample Size
The sample size for the two corpora are as follows:
⦁ Corpus A: The 248 articles identified by Shane and Ulrich (2004) published in Management Science between 1954-2004 that discuss technological innovation, product development, and entrepreneurship.
⦁ Corpus B: The 1625 articles published in the Management Science journal from 2005-2015 on all topics.
Summary
These two corpuses were selected as they will generate different information:
⦁ The results from the review of Corpus A will be compared against the expert review previously generated by Shane and Ulrich (2004), to determine the efficacy of the proposed process and tools.
⦁ Once the proposed process has been validated, it will be used to analyze Corpus B. The resulting topic model will extend Shane and Ulrich’s work as well as provide a point of comparison regarding the speed of the proposed process in analyzing a larger corpus.
Overview of Steps
Data Acquisition
Copies of Management Science articles published from 1954-2004 previously identified by Shane and Ulrich’s review (2004) (“Corpus A”) were obtained, extracting relevant information (title, abstract, publication year). The Web of Science database was used to collect information regarding all articles published in Management Science from 2005-2015 (“Corpus B”).
Data Analysis
Select Topic Modeling Tools
Tools and methods suitable for replicating and extending the expert topic review were selected based on the literature review. This step also included installing different software applications prior to selecting a topic modeling tool.
Preprocess & Process Data
Identified and eliminated obvious errors in the data (“clean” the data), including addressing issues that arose during preprocessing. Preprocess data (remove stop words, normalization) and create models for different number of topics using selected implementation of topic modeling algorithm. For each model, export reports and spreadsheets that contain key information (topic IDs and distribution per article, top 10 topic words, word clouds, topic word distributions).
Select & Interpret Topic Model
Evaluate the models based on selected heuristics. Identify the model with the optimal number of topics and remove low-value topics as required. Using methods for Labeling topic models, begin interpreting topic model. Remove any additional low-weighted or incoherent topics.
Analyze the Model
Use topic models to generate charts detailing the number of publications published per year per topic, as well as the distribution of topics over time. Review topic evolution and discuss trends.
Compare Results
Compare results of final categorization and results to expert review previously published by Shane and Ulrich (2004). Identify areas of similarity and disparity, discuss results.
Extend Analysis (Corpus B)
Apply the process (steps iii-vi) to a larger corpus (“Corpus B”: all articles published in Management Science from 2005-2015). Demonstrate how the process works on a larger corpus that could not be processed manually.
Summarize Process
Based on the insights generated through the selection of the tools and the selected heuristics, generate a summary outlining the replicable process for generating topic models
Topic Modeling Tools
While the author had previous experience with the software program R and had identified multiple studies that utilized MALLET (Amin, 2016; Jockers & Mimno, 2013; Rader & Wash, 2015; Tapelova, 2017), both programs were deemed unsuitable either through the requirement that the user is familiar with command-line programming (R) or the requirement for the installation of additional software (ex. MALLET requires Python).
An open-source tool that has not been discussed in the literature in relation to topic modeling is Orange (https://orange.biolab.si/). Orange is a machine learning and data visualization tool with interactive data analysis workflows and a number of easily-installed add-ons that increase functionality. It has a simple GUI which allows individuals to use the tool without any programming knowledge. Any add-ons that are required (e.g. Textable, which includes topic modeling, word cloud, and text preprocessing sub-modules) to provide the required functionality are easily added from a panel within the program.
As the objective was to select software that could be used “out of the box” with minimal programming knowledge on the part of the user, Orange was selected for the generation of the topic models. It is expected the results obtained using Orange will be of similar quality to using MALLET from the command line or programmatically as the LDA components are, in fact, a wrapper around MALLET. For the analysis phase, Excel was used as a software license is available free of charge to all students at the university. Further, as a widely-used electronic spreadsheet tool in the private sector, any formulas required can easily be found using an online search. The selection of these two tools is intended to minimize the complexity and cost of the topic modeling tools.
Management Science (1954-2004)
Generate Topic Models
Data Acquisition
Each article from the corpus identified by Shane and Ulrich (2004) (“Corpus A”) was retrieved from the Web of Science database. Typos and duplicates were identified and removed from the original corpus, reducing the number of articles from 250 to 248. The authors name, article publication year, title, abstract, and keywords were collected and consolidated into a CSV file. Several older documents either (a) did not have abstracts in the Web of Science database, although abstracts had appeared in the journal articles, or (b) did not have an abstract. For the former, open-source OCR software was used to extract the abstracts. For the latter, the Shane and Ulrich (2004) description was used instead, as the first paragraph of the articles did not provide a relevant summary.
Data Preprocessing
The selected topic modeling software (Orange) was downloaded and a workflow developed.
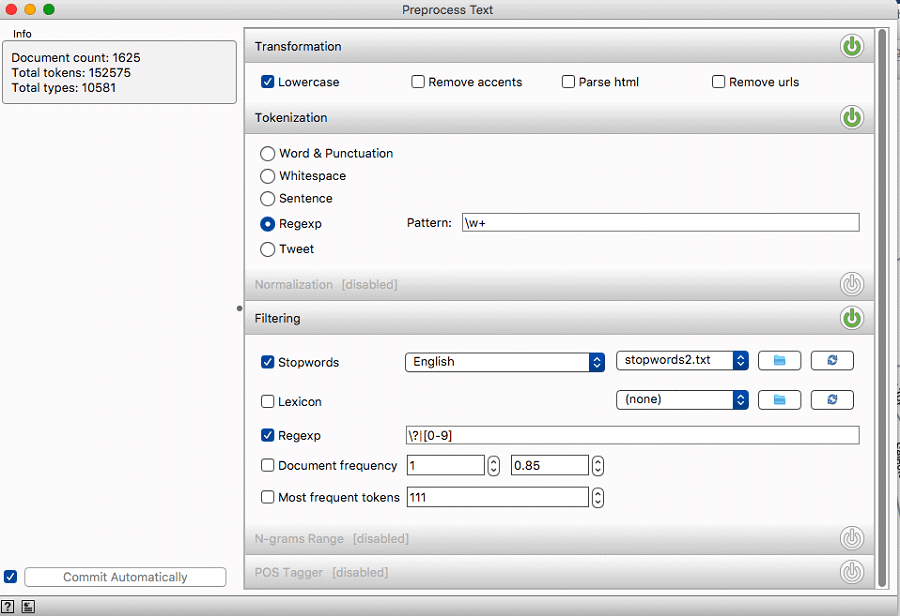
The initial stop word list was determined to be too short; a longer list was identified and downloaded (https://www.ranks.nl/stopwords) and words were added to that list. These included common terms found in academic articles (ex. article, paper, etc.), locations, and authors’ names. This is consistent with Jockers and Mimno (2013), who noted the importance of removing words that occur so frequently – and with such regularity in all documents – that they overwhelm topical variability.
Further manual preprocessing of the data was required as, during trial runs, it was discovered that the preprocessing step was removing critical key terms which contained punctuation (R&D and R, D & E). These terms were standardized so that they would not be affected by the removal of punctuation (randd and RDandE), and several unintentional errors were manually corrected (Linear & deterministic had become LineaRandDeterministic). Further, embedded references that contained names of other researchers were manually removed from the source file. These changes ensured that the input data to the topic model contained minimal noise.
Generation of Topic Models
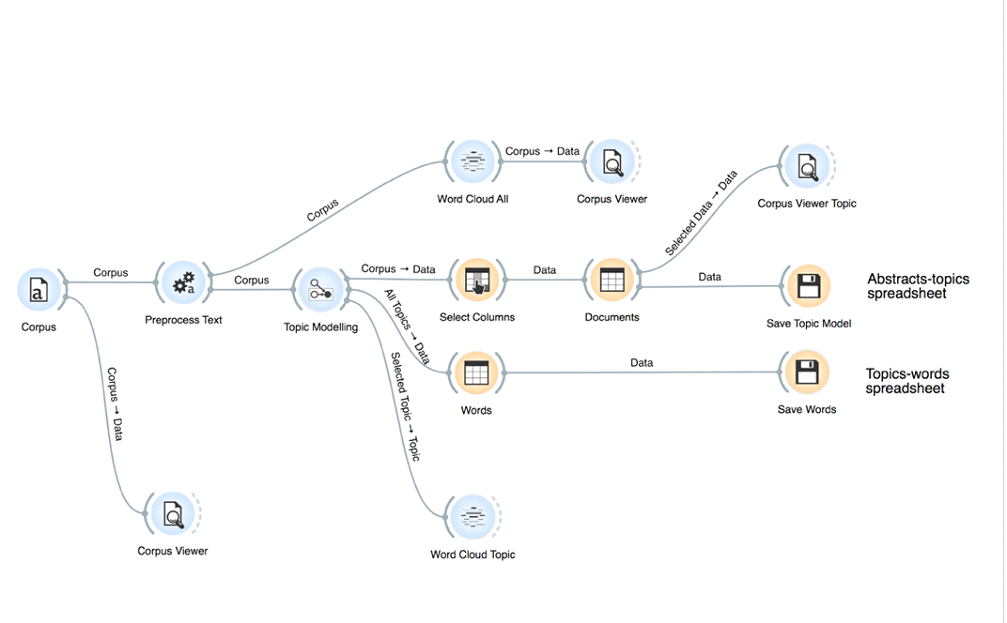
The following process was used to generate the topic models for review:
⦁ Generated models for topic models (5, 10, 15 … 40 topics). For each model:
⦁ Generated and saved word clouds for each topic in each model.
⦁ Saved outputs (Models, Words) as CSV files (Figure 4-3).
⦁ Saved top 10 keywords for each topic model as a report; exported report as PDF.
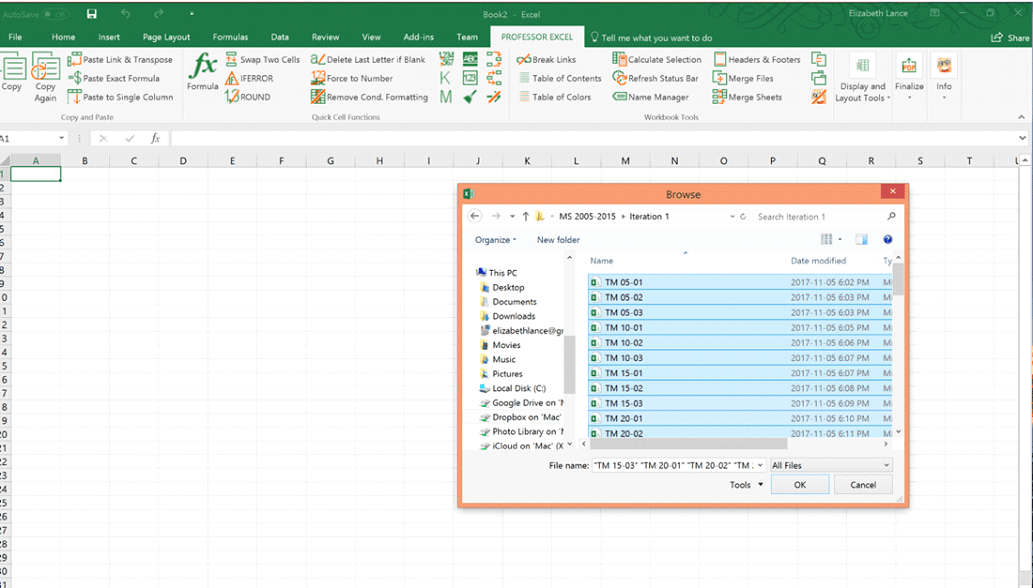
⦁ Combined all Model and Word CSV files into a single Excel file (Figure 4-4).

Selection of Optimal Topic Model
As noted in the literature review, there are several quantitative approaches that could be used to evaluate the topics and select a topic model; however, quantitatively significant models are not necessarily the most interpretable by humans (Chang et al., 2009). Further, computing those metrics is beyond the scope of the selected topic modeling software, Orange.
Since the purpose is to find the model with useful interpretation, the selection of the optimal model is inherently subjective as it is based on the researcher’s initial research questions and their ability to interpret the model. The author identified three key metrics that would help determine the model with the optimal number of topics:
⦁ Overall importance of topics;
⦁ Coherence of topic keywords; and
⦁ Identification of recurring topics (duplication of topic keywords) between models.
Overall Importance of Topics
The overall importance of the topics was determined and topics of low importance were removed by identifying the topics that explain 90% of the papers (i.e., the topics are sorted starting with the most probable topic and their probabilities until the 90% threshold of coverage is reached). This approach was used by Mathew et al. (2016), with the following rationale:
While our LDADE reported many more topics than these top 11, those occur at diminishingly low frequencies. [Other researchers] also report that 90% of the topics [in Software Engineering] can be approximated by about a dozen topics (p. 6).
This metric can help the reviewer narrow the scope of which topics to review and identify those topics that occur at higher frequencies. A secondary benefit of this approach is that the topics are now sorted by weight: topics with higher weight are often easier to interpret as they have more supporting documents (Mathew et al., 2016).
Steps: To calculate the overall importance of topics the following steps were conducted:
⦁ Determined the average weight of each topic model (using =AVERAGE function in Excel).
⦁ Sorted topics left-to-right for highest-to-lowest average weight.
⦁ On a new sheet (“Summary”), listed the top 10 keywords for each model, the topic model, topic number, topic weight (transposed from individual sheets).
⦁ Identified topics that covered 90% of papers for each model. Identified these in a separate column.
⦁ On a new sheet (“90%”), created a pivot table that identified the number of topics per model that represented the top 90% of topics.
⦁ On a new sheet (“Dashboard”), added tables to visualize the summarized results from the pivot tables.
Output: The following tables were generated:
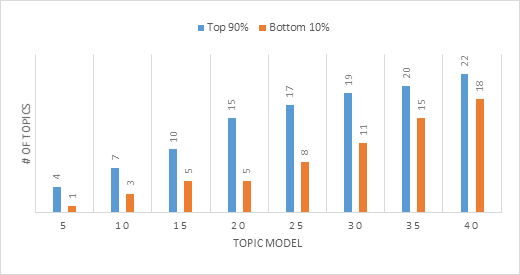
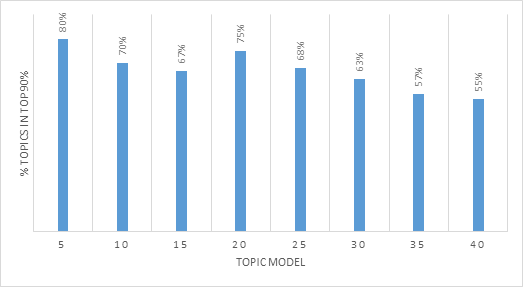
Analysis: As the number of topics increases, the coverage decreases (i.e., a smaller % of the topics relative to the topics represents to top 90%). While this heuristic could suggest that Topic Model 5 or 20 has the best coverage (80% and 75%, respectively), there is a concern that if there are too few topics, the topics will be too general. As we explored the higher number of topics, some low weight topics gained a greater weight and were included in the 90%. Review of the above suggests that the number of topics stabilizes between 30 and 35; however, the number of topics should be determined by considering all identified heuristics.
Next Steps: Proceed to next heuristic. All the topics that represented less than 10% of the total topics were excluded from the next step of the review process.
Coherence
Mathematically rigorous calculations of model fit (such as log likelihood and perplexity) do not always agree with human opinion about the quality of a model (Chang et al., 2009). While there is a newer formula that has been identified as possibly being able to correlate well with human judgement (‘C_v topic coherence’ in GENSIM), this formula relies on judging how often the topic words appear together in a corpus; however, the definition of ‘together’ remains subjective (Mimno, 2012).
While the headwords are those that are the most heavily weighted, another useful heuristic is reviewing overall coherence of the top 10 keywords identified. A manual review to evaluate the quality of the topics inferred by the model based on whether there was obvious word or topic intrusion can assist the reviewer in identifying the topic model with the greatest cohesion.
Steps: Coherence was determined by conducting the following steps:
⦁ On the “Summary” sheet, reviewed the keywords for the topics that are included in the top 90% of each topic model for coherence. In a new column, assigned a score of high, medium, or low cohesion in a separate column;
⦁ On a new sheet (“Coherence”), created a pivot table that identified the number of topics per model and counted the coherence labels of high, medium, or low cohesion; and
⦁ Generate charts to visualize the summarized results from the pivot table.
This identified the model with the highest number of cohesive terms, both in terms of those labeled as “high” as well as the combined score for “high” and “medium”.
Output: The following tables were generated:
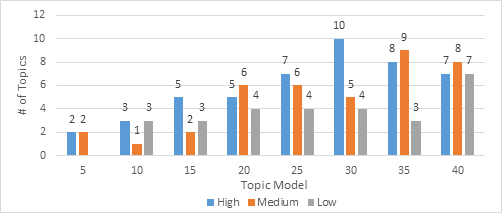
Analysis: In reviewing the above chart, Topic Model 35 appears to have the highest proportion of medium and high coherence topics; however, Topic Model 30 has the highest proportion of high coherence topics. There is a “peak” where model 30 has the most coherent topics; the topics need to be evaluated further to determine if this model is the correct fit.
Next Steps: Review topics to and identify recurring topics based on top 10 keywords.
Recurring Topics / Keywords
The topic modeling software generates a list of the top 10 terms associated with each topic. If there are topics that appear repeatedly across multiple topic models, this would suggest that the topic is a relatively stable one.
Steps: To identify recurring topics, the following steps were performed:
⦁ Created formula in Excel to show only the first 2-4 words for each topic label and added a column where the number of words to include is identified:
=TRIM(LEFT(SUBSTITUTE(E2,” “,REPT(” “,1000),R2),1000)), where E2 is the cell containing text to be trimmed and R2 is the cell that identifies how many words to include.
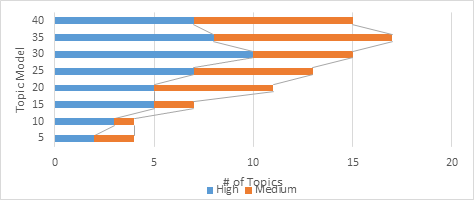
⦁ Generated pivot tables and charts to identify # of identical topics for 3, 4, and 5 words; and
⦁ Generated pivot table and chart to identify model containing most stable topics.
Output: The following tables were generated:
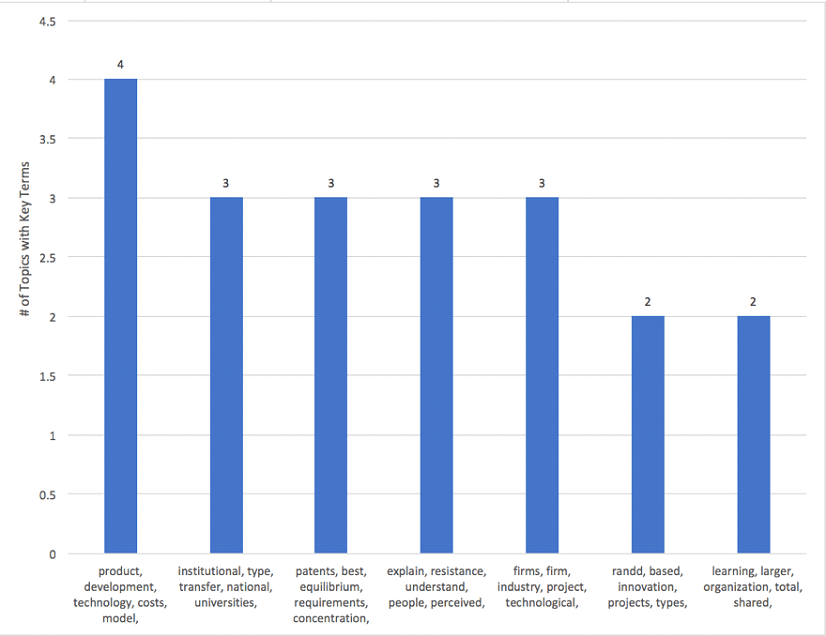
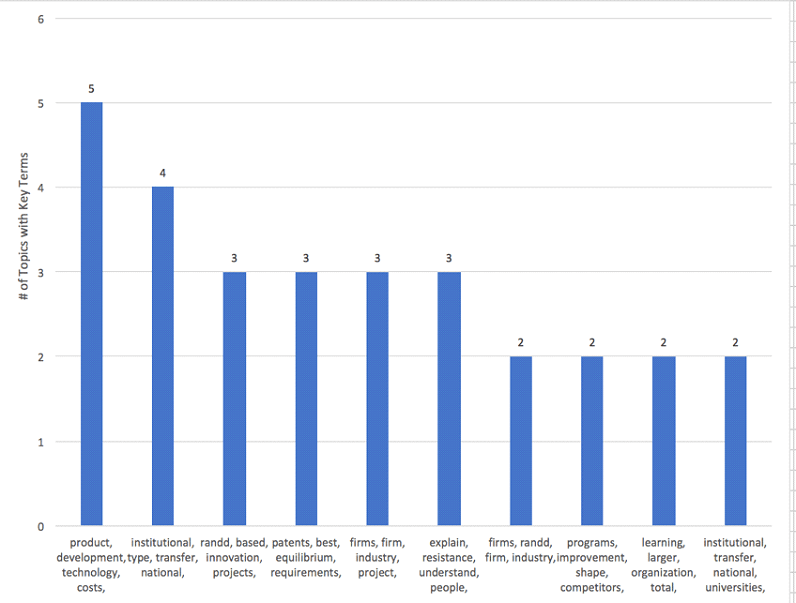
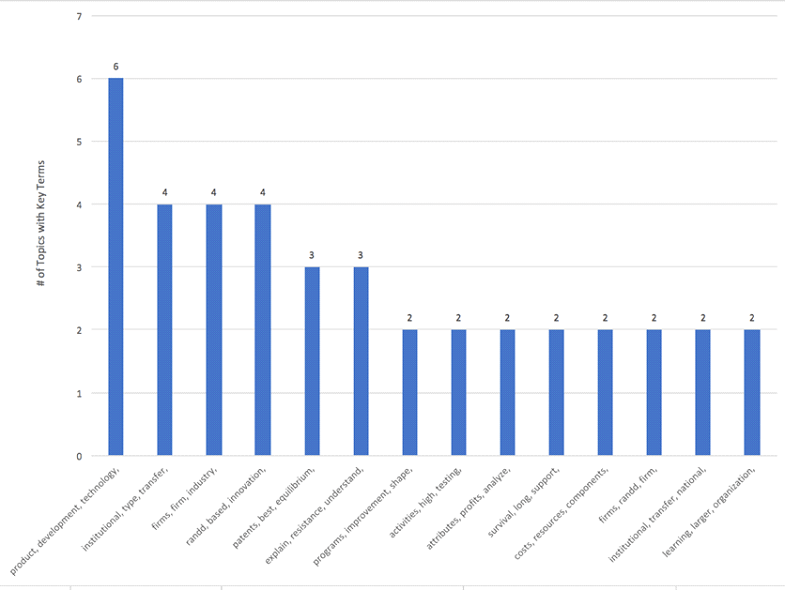
Analysis: Once the scope is limited to three headwords, nuanced changes begins to occur (ex. institutional, type, transfer vs. institutional, transfer, national). It is reasonable to conclude that there will be several topics in the final model that are relatively stable. The final model should include all the following topics: Product Development, Institutional Transfer, R&D / Innovation, Patents, Explaining Resistance / Understanding People, Firms / Projects, and Organizational Learning.
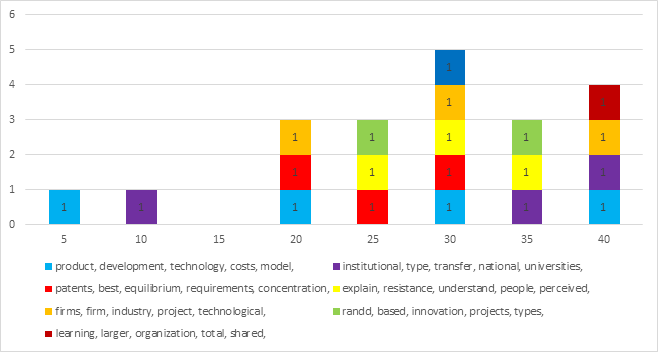
In reviewing the topic models, Topic Model 30 has all the above topics and contains the most recurring topics. Topic Model 30 was selected for further review.
Labeling Topics (Initial Interpretation)
Topic Headwords
The initial results from the above analysis narrowed the scope of the topic models and identified several key topics that should appear in the final model. The topic model was further reviewed to determine if they could be labeled in a manner that is easily understood using the first few words. Labeling based on the first few terms or “topic headwords” has been identified as appropriate by multiple authors (Jockers, 2013; Mathew et al., 2017). While this approach is appropriate for topic models with many topics (ex. Jockers had > 500 topics), our objective was to ensure that all topics could be labeled in a manner that is helpful to a reader that has minimal knowledge of the area.
Steps: The process to generate topic headwords were:
⦁ Organized the topics in terms of topic weight from highest to lowest (top to bottom).Inserted column to identify rank and number accordingly (see Table 4-1, below).
⦁ Used the TRIM formula in Excel to show only the first 2-4 words for each topic labeled as “High” or “Medium” coherence.
⦁ Reviewed automatically generated labels. Adjusted for ease of reading (as required).
Output: The following table was generated:
| Topic # | Rank | Keywords | Generated Label |
|---|---|---|---|
| 20 | 1 | randd, based, innovation, projects, process, types, cost, organizations, multiple, decision | randd, |
| 26 | 2 | product, development, technology, costs, model, resources, time, market, variety, basic | product, development, |
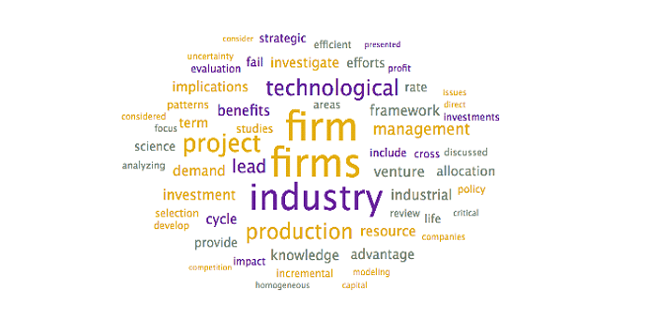
| 28 | 3 | firms, firm, industry, project, technological, production, lead, management, implications, benefits | firms, firm, industry, project |
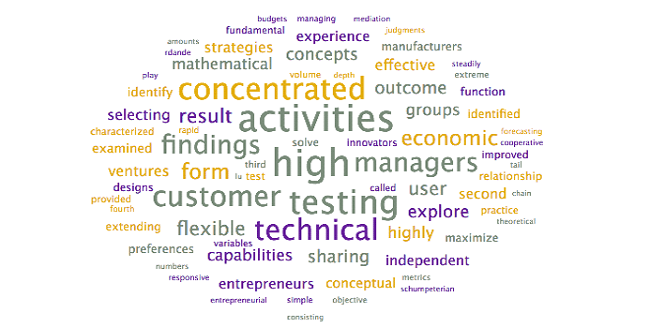
| 30 | 4 | activities, high, testing, concentrated, technical, customer, managers, findings, form, economic | activities, high, testing, |
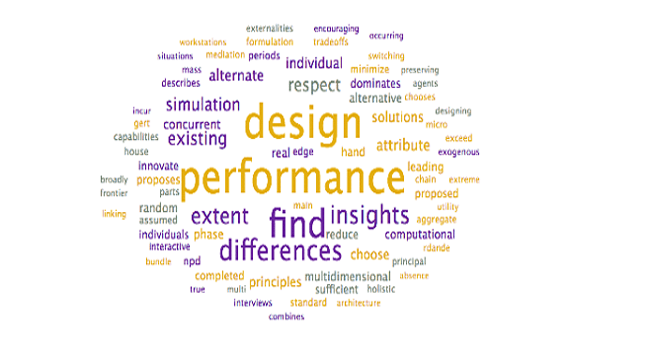
| 6 | 5 | performance, design, find, differences, insights, extent, existing, respect, simulation, alternate | performance, design, |
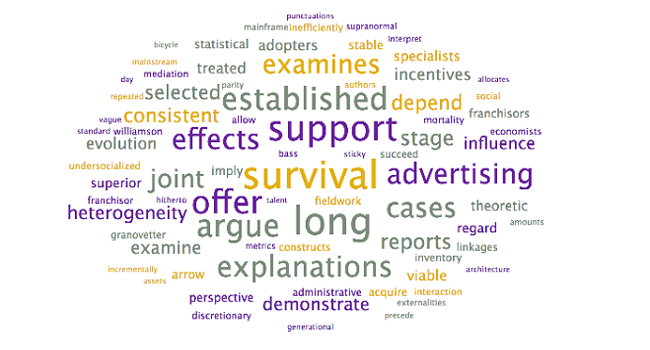
| 7 | 6 | survival, long, support, argue, offer, established, cases, advertising, explanations, effects | survival, long, |
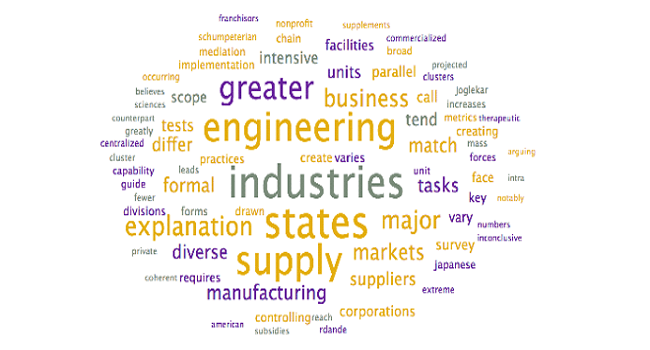
| 17 | 7 | industries, states, engineering, supply, greater, explanation, major, business, markets, manufacturing | industries, states, engineering, |
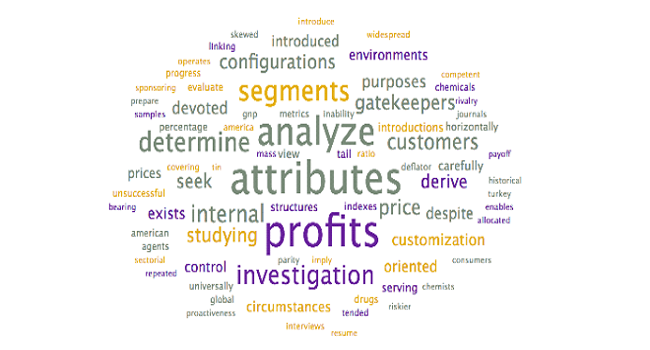
| 12 | 8 | attributes, profits, analyze, segments, determine, investigation, internal, customers, configurations, price | attributes, profits, analyze, |
| 19 | 9 | institutional, type, transfer, national, transaction, universities, relative, positive, institutions, university | institutional, type, transfer, |
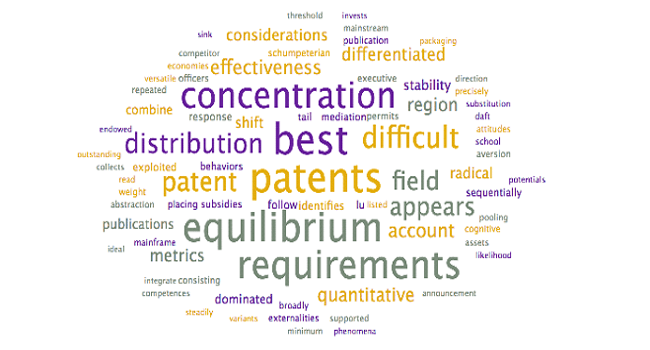
| 23 | 10 | patents, best, equilibrium, requirements, concentration, distribution, difficult, patent, field, appears | patents, best, |
| 16 | 11 | learning, larger, organization, total, shared, reality, single, curve, specialization, contrast | learning, larger, organization, |
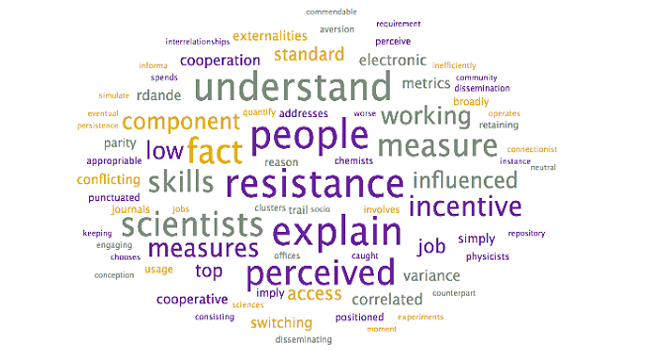
| 22 | 12 | explain, resistance, understand, people, perceived, scientists, fact, skills, measure, incentive | explain, resistance, understand, people |
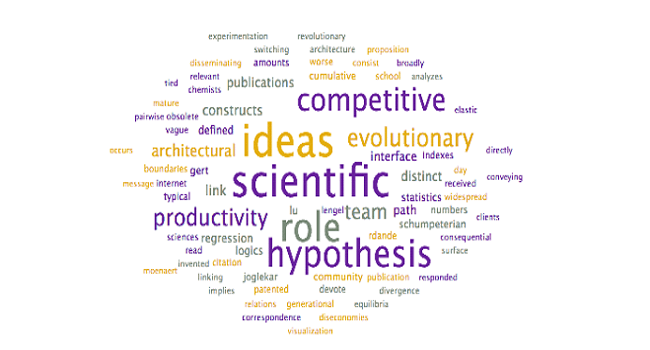
| 11 | 13 | scientific, ideas, hypothesis, role, competitive, evolutionary, productivity, team, target, architectural | scientific, ideas, |
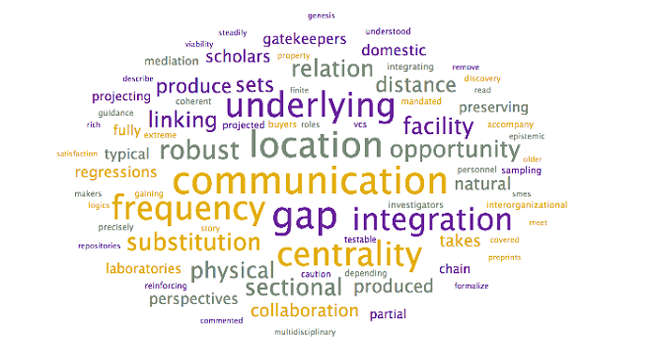
| 13 | 14 | communication, location, gap, frequency, underlying, centrality, integration, robust, relation, opportunity | communication, |
| 25 | 18 | programs, improvement, shape, competitors, metrics, program, exceeds, finding, roles, respond | programs, improvement, |
| Original Topic Label | Label (Generated in Excel) | Label (Human Readable) |
|---|---|---|
| 20 | randd, | R&D [randd] |
| 26 | product, development, | Product Development |
| 28 | firms, | Firm Projects |
| 30 | activities, high, testing, | Testing Activities |
| 6 | performance, design, | Performance / Design |
| 7 | survival, | Survival |
| 17 | industries, states, engineering, | Engineering |
| 12 | attributes, | Attributes |
| 19 | institutional, type, transfer, | Institutional Transfer |
| 23 | patents, | Patents |
| 16 | learning, larger, organization, | Organizational Learning |
| 22 | explain, resistance, | Explaining Resistance |
| 11 | scientific, ideas, hypothesis, | Scientific Ideas |
| 13 | communication, | Communication |
| 25 | programs, improvement, | Improvement Programs |
Analysis: The above labels appear reasonable when reviewed in table format; however, some of the terms have little meaning when viewed in isolation or as part of a ten (10) word summary. What is meant by Survival, Firm Project, Attributes or Improvement Programs? There is insufficient context to determine what is meant by some of these terms.
Next Steps: Additional review is required for identified topic labels, using additional heuristics (word clouds, titles/abstracts).
Word Clouds
To assist with the interpretation and verification of each of these topics, word clouds were generated to see if additional context could be provided. Specifically, the word clouds provide context for the headwords, allowing researchers to differentiate between similar terms (ex. words in the context allow researchers to disambiguate “market” as in “selling into a market” – other words may include customer, demand – from “stock market” – other words may include stock, valuation, option).
Steps: To generate word clouds, each topic was selected and the word cloud is saved (during the initial topic model generation step, as above). Reviewed the word clouds associated with each topic to determine if the topic labels can be further refined, based on context. Larger terms in the word clouds have higher weights within the topic and appear more frequently
Output: The following word clouds were generated:
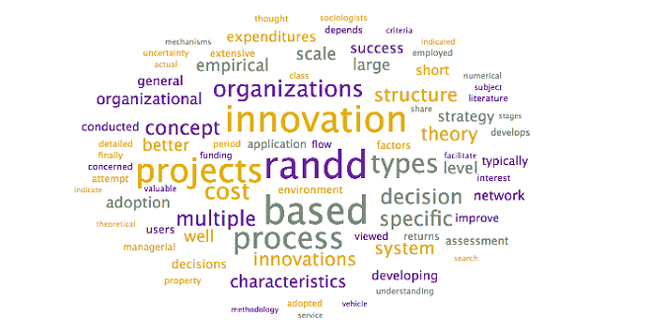
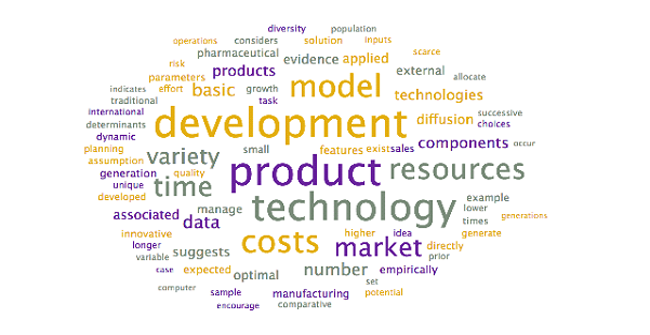
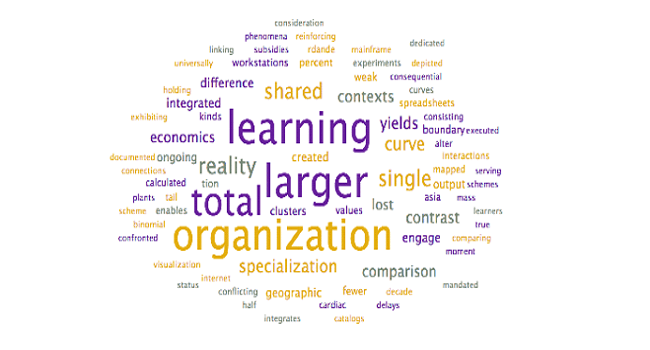
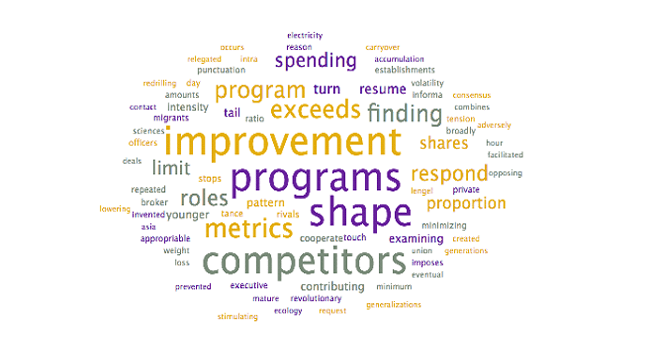
Analysis: The above word clouds help confirm the selected topic labels for the topics which were already clear, with one exception:
⦁ Scientific Ideas. This topic appears to discuss the evolution of scientific ideas, including the generation of hypotheses and the role it plays with productivity. It’s unclear from the word cloud exactly what the title should be, as the scientific ideas label may not be accurate. There may be a more appropriate way of Labeling this topic, such as Evolution of Ideas.
The word clouds provided only minimal additional insight for the topics that are unclear:
⦁ Survival. The words that are in the word cloud are more descriptive in nature, with a focus on explanatory terms (ex. examines, established, explanation). A suggested alternative title could be Explaining Survival; however, this still does not answer the question “Survival of what?” It cannot be established if this is survival of firms or ideas without further review.
⦁ Firm Projects. After the terms “firm” and “firms”, the focus is on the terms: technological, projects, production, and industry. A suggested alternative title could be Technological Projects and Production in Firms; however, due to the length, additional review is suggested.
⦁ Attributes. Other key terms identified by the word cloud include analyze and profits. It is inferred that this topic is in relation to identifying and analyzing attributes related to increasing profits. This is further supported by terms such as segments, gatekeepers, and customers – terms typically associated with generating income. A suggested alternative title could be Customer Attributes; however, additional review is required.
⦁ Improvement Programs. The word cloud suggests that this topic discusses the use of improvement programs to stay competitive. A new label is not suggested.
The following adjustments were made to the topic labels:
| Label (Human Readable) | Label (Word-Clouds) |
|---|---|
| R&D [randd] | R&D [randd] |
| Product Development | Product Development |
| Firm Projects | Technological Projects and Production in Firms |
| Testing Activities | Testing Activities |
| Performance / Design | Performance / Design |
| Survival | Explaining Survival |
| Engineering | Engineering |
| Attributes | Customer Attributes |
| Institutional Transfer | Institutional Transfer |
| Patents | Patents |
| Organizational Learning | Organizational Learning |
| Explaining Resistance | Explaining Resistance |
| Scientific Ideas | Evolution of Ideas |
| Communication | Communication |
| Improvement Programs | Improvement Programs |
Next Steps: Review abstracts and titles for additional context.
Review of Abstracts and Titles
A final verification is to review the abstracts and titles associated with each topic, to determine if there are more appropriate labels and whether they have been classified correctly. For each topic in a document, LDA produces a weight of that topic in the document, which approximately corresponds to the percentage of the document about that topic (Rader & Wash, 2015). This can be used to identify the primary and secondary topics present in a document and help the researcher identify which articles to review.
Steps:
⦁ In the sheet for the selected topic model, inserted two new columns: Highest Weight and Second Highest Weight.
⦁ Used the INDEX function of Excel to identify the topic with the highest weight across all topics in the topic model. =INDEX($A$1:$AN$1,0,MATCH(LARGE($A2:$AN2,1),$A2:$AN2,0))
⦁ Used the INDEX function of excel to identify the topic with the second-highest weight across all topics in the topic model.
=INDEX($A$1:$AN$1,0,MATCH(LARGE($A2:$AN2,2),$A2:$AN2,0))
⦁ Generated a pivot table that identifies the number of articles associated with the highest topic for each article;
⦁ In the original topic model spreadsheet, used the Sort & Filter functionality to identify highest-weighted articles in each topic.
⦁ Review titles & abstracts for articles for top ~10% of highest weighted articles for each topic (more if the count was less than 10 articles).
⦁ Adjust topic labels as required.
Output: The following table was generated to determine the overall number of articles associated with each topic:
| Row Labels | Count of Highest | Percentage of Total |
|---|---|---|
| R&D | 65 | 31% |
| Product Development | 65 | 31% |
| Technological Projects and Production in Firms | 23 | 11% |
| Explaining Survival | 7 | 3% |
| Performance / Design | 6 | 3% |
| Institutional Transfer | 6 | 3% |
| Customer Attributes | 65 | 31% |
| R&D | 6 | 3% |
| Organizational Learning | 6 | 3% |
| Testing Activities | 65 | 31% |
| R&D | 5 | 2% |
| Evolution of Ideas | 5 | 2% |
| Communication | 4 | 2% |
| Engineering | 3 | 1% |
| Patents | 3 | 1% |
| Explaining Resistance | 3 | 1% |
| Improvement Programs | 2 | 1% |
| Grand Total | 209 | 84% |
R&D was identified as the primary topic in 65 of the articles, representing over 31% of the articles in Corpus A. Similarly, Product Development represents over 31% of the articles in Corpus A and was identified as the primary topic for 65 of the articles. The combined total of these two categories is in excess of 62% of the articles in the journal. This is expected, as the articles selected by Shane and Ulrich (2004) focused on research and development, innovation, product development, and entrepreneurship. To ensure the articles are labeled correctly, the second highest weight topics should be reviewed for both R&D and Product Development.
It was determined that when sorted by topic weight, the topic Communication included several articles that the model has identified as being associated with R&D and Product Development (Highest Weight) in addition to Communication (Second Highest Weight). Upon review of the titles and abstracts for these articles, it became apparent that the articles with a weight of 0.25 or more discuss communication. As such, they were manually adjusted to be associated with Communication.
| Topic Weight (Communication) | Highest Weight | Second Highest Weight | Manual Allocation |
|---|---|---|---|
| 0.386892945 | Communication | R&D | Communication |
| 0.31864199 | Communication | Firms | Communication |
| 0.287499875 | Communication | R&D | Communication |
| 0.274573684 | R&D | Communication | Communication |
| 0.25113526 | R&D | Communication | Communication |
When the same process was repeated across all topics, it resulted in the following new distribution of articles per topic:
| Topic | Manual Allocation | Percentage of Total |
|---|---|---|
| Product Development | 58 | 28% |
| R&D | 58 | 28% |
| Technological Projects and Production in Firms | 24 | 11% |
| Customer Attributes | 8 | 4% |
| Performance / Design | 8 | 4% |
| Explaining Survival | 8 | 4% |
| Patents | 6 | 3% |
| Evolution of Ideas | 6 | 3% |
| Institutional Transfer | 6 | 3% |
| Communication | 6 | 3% |
| Organizational Learning | 6 | 3% |
| Explaining Resistance | 4 | 2% |
| Engineering | 5 | 2% |
| Testing Activities | 4 | 2% |
| Improvement Programs | 2 | 1% |
Analysis: After reviewing the titles and abstracts, the following was observed:
⦁ Communication. The top five articles associated with this topic (>0.25 weight) focus on how communication impacts R&D, with one article using terms the topic modeling system appears to have identified as being synonymous with communication (“interacting process”).
⦁ Customer Attributes. This group of journal articles discusses customer segments and managerial decisions. It is better labeled as Decision Making, as this applies equally to both customer segmentation and managerial decisions.
⦁ Technological Projects and Production in Firms. This group of journal articles discusses how research projects are selected and resources allocated, with resources being either internal, governmental, or venture capital funds. A more appropriate title would be Resource Allocation.
⦁ Explaining Survival. This group of journal articles discusses common survival techniques – including advertising, diffusion of innovation, and contracting – as they apply to both startups and established companies. A better label for this topic would be Survival Techniques.
⦁ Testing Activities. This group of journal articles predominantly refers to using lead users to test and develop concepts. A suggested alternative title is Lead Users.
⦁ Note: Two outlier articles were identified and reallocated to their second-highest weighted topics as they did not fit the overall patterns: Computational Experience with Variants of the Balas Algorithm Applied to the Selection of randd Projects (0.33) and Entrepreneurial Ability, Venture Investments, and Risk Sharing (0.28).
⦁ Patents. The review of this group of articles identified that this is a cohesive topic that discusses patents. Interestingly, the top-weighted article (0.47) does not have patents as the focus of the article – they are merely the dataset used by the authors for a study in relation to a separate research question (Technology Firms and New Firm Formation).
⦁ Note: One article that focused on patents (Patents and Innovation: An Empirical Study) had a relatively low topic weight in relation to Patents (0.15). Instead, the topic model assigned this article to Product Development (0.20) and R&D (0.18).
⦁ Explaining Resistance. This is a cohesive topic that discusses resistance to adopting innovation within a firm.
⦁ Note: There are two outlier articles in this topic, including the article with the highest weight in this topic (0.35). The article – Commercializing Knowledge: University Science, Knowledge Capture, and Firm Performance in Biotechnology – may be better allocated to Technology Transfer, but is weighted extremely low (0.09) by the topic modeling software. This article has been left as being allocated to Explaining Resistance to avoid unnecessary manual intervention, as it could not be allocated to their second-highest weighted topics.
⦁ Improvement Programs. A review of the top three articles associated with this topic identified no clear topic (State-Level Efforts to Transfer Manufacturing Technology: A Survey of Programs and Practices, A Nonsequential randd Search Model, CEO Characteristics and Firm randd Spending.) Due to the low value and lack of cohesiveness in the articles, this was removed as a topic from the model.
With the removal of Improvement Programs, a total of 207 articles are classified using this topic model (84% of the original 248 in Corpus A). The following adjustments are made to the topic labels:
| Label (Human Readable) | Label (Word-Clouds) | Updated Label (Title/Abstract Review) |
|---|---|---|
| R&D [randd] | R&D | R&D |
| Product Development | Product Development | Product Development |
| Firm Projects | Technological Projects and Production in Firms | Resource Allocation for R&D |
| Testing Activities | Testing Activities | Lead Users |
| Performance / Design | Performance / Design | Design Performance |
| Survival | Explaining Survival | Survival Techniques |
| Engineering | Engineering | Organizational Structure |
| Attributes | Customer Attributes | Decision Making |
| Institutional Transfer | Institutional Transfer | Technology Transfer (Universities) |
| Patents | Patents | Patents |
| Organizational Learning | Organizational Learning | Organizational Learning |
| Explaining Resistance | Explaining Resistance | Explaining Resistance (Individuals) |
| Scientific Ideas | Evolution of Ideas | Evolution of Ideas |
| Communication | Communication | Communication |
| Improvement Programs | [Removed.] | [Removed.] |
Final Topic Model: Description and Visualization
After selection and verification of the model, the final list of topics and their interpretation are described in Table 4-9, below.
| Topic | # of Articles | Years Covered | % of Total | Description |
|---|---|---|---|---|
| Product Development | 58 | 1964-2004 | 28% | The articles associated with this topic discuss product development and associated considerations in the management science. This includes timing for purchasing new products, market timing / entry decision, diffusion theories, development cycles, and associated models |
| R&D | 58 | 1964-2002 | 28% | The articles discuss R&D and innovation. These include innovation adoption, budget allocation to innovation, discussion of R&D models, etc. |
| Resource Allocation for R&D | 24 | 1968-2003 | 11% | This topic discusses the allocation of resources for R&D, with a focus on public external funding (incl. federal policies, government seed money, subsidies/entry taxes), private external funding (seed, venture capitalists), and internal funding through product life cycles (product selection choices, R&D models, resource allocation) |
| Decision Making | 8 | 1980-2002 | 4% | This topic focuses on measuring decision making, as it relates to user segmentation and managerial decisions. It addresses a broad range of industries, including software and green product development. Most of the articles are published in the 1980s. |
| Design Performance | 8 | 1977-1998 | 4% | This topic discusses measuring product design performance models, looking at heuristics for evaluating optimal product design models. Timing of activities (concurrent, sequential) is discussed |
| Survival Techniques | 8 | 1978-2002 | 4% | This topic discusses what actions must be taken to ensure the survival of a firm. Articles discuss the influence of advertising on product diffusion, the role of contracting in firm survival, and information asymmetry in startups. |
| Patents | 6 | 1984-2002 | 3% | This articles in this topic are mixed – they discuss the role of patents as well as the adoption of new technologies. |
| Evolution of Ideas | 6 | 1978-2003 | 3% | The articles associated with this topic discuss how ideas evolve within an organization, with a focus on knowledge within the firm. This includes “tacit knowledge and cumulative learning” and the generation of ideas. |
| Technology Transfer (Universities) | 6 | 1992-2003 | 3% | This is a particularly cohesive topic – focus is on technology transfer between universities and firms. For the six articles, institutional technology transfer or knowledge transfer are explicitly described in the titles, with a focus on technology licensing in the early 2000s (4 of 6 articles). |
| Communication | 6 | 1973-1998 | 3% | These articles focus on how communication impacts R&D, with one article using terms the topic modeling system appears to have identified as being synonymous with communication (“interacting process”) (Effectiveness of Nominal and Interacting Group Decision Processes for Integrating randd and Marketing). |
| Organizational Learning | 6 | 1975-2003 | 3% | This topic discusses learning within an organization, with a specific focus on the learning curve (62%). Of the eight articles associated with this topic, two appear in the 1970s while the rest are published between 1990 and 2003, with those associated with the concept of a “learning curve” being published between 1990-2001. |
| Explaining Resistance (Individuals) | 4 | 1988-2002 | 2% | This topic relates to the acceptance of new technology by different individuals, with an emphasis on software adoption by managers. |
| Organizational Structure | 5 | 1983-2002 | 2% | This topic discusses the effect of organizational structure and the allocation of firm resources (human capital), with a particular emphasis on business units. |
| Lead Users | 4 | 1988-2002 | 2% | This grouping of articles discusses the shifting of innovation to users (“lead users”) through market research and toolkits, in addition to testing of new product concepts. |
Distribution of Articles Across Topics by Year
The following table identifies the number of articles published per topic, per year:
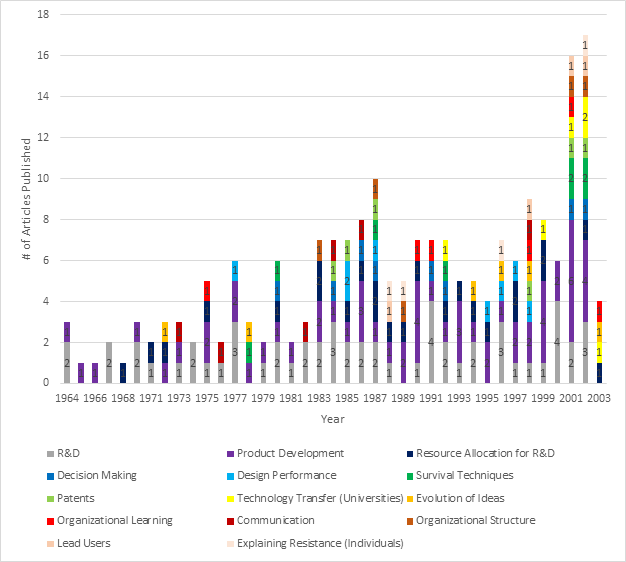
Starting in 1970, the publication of articles related to R&D remains relatively consistent; however, in the early 1960s there are several years without any publications associated with R&D. Table 4-13 shows the increase in interest in Product Development particularly in the late 1990s and early 2000s, as well as the appearance of Technology Transfer (Universities) in the early 2000s. The publication of articles related to other topics varies based on this chart; additional insights are likely to be generated through the graph identifying topics over time (Figure 4-14).
Evolution of Topics over Time
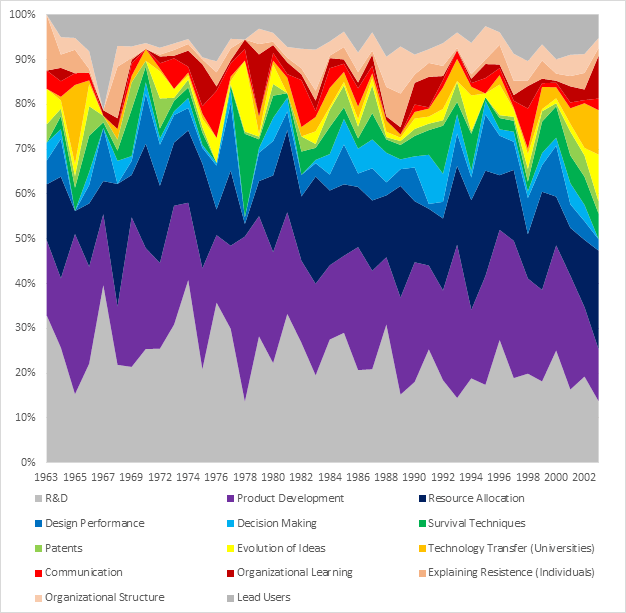
At a glance, there is considerable variation in terms of the overall percentage of any given topic (between 6% and 25%). The topics with the most articles (Product Development, R&D, and Resource Allocation for R&D) show the widest range over the 50-year period: Product Development varies by 25% (minimum 9%, maximum 34%), followed by Research & Development (minimum 11%, maximum 33%) and Resource Allocation for R&D (minimum 2%, maximum 26%). All other topics fluctuate between 0-17% over the same reporting period. This can be explained by examining the time period and sample size: each of the remaining topics have 8 articles or less published over a 50-year period. As such, each article published has a larger impact on the popularity of the topic.
Comparison to Expert Review (Shane and Ulrich, 2004)
Prior to proceeding to the analysis of Corpus B, the results of the topic modeling process for Corpus A will be compared to those of an expert review. The methodology of Shane and Ulrich (2004) is as follows:
⦁ Reviewed all scholarly articles published in Management Science from 1954 to 2004;
⦁ Identified articles that fall within the domain of the current department of Research and Development, Innovation, Product Development, and Entrepreneurship;
⦁ Scanned titles and abstracts of every article published in the journal for the following keywords: entrepreneur, entrepreneurship, venture, product development, product design, technological innovation, and research and development (R&D);
⦁ Scanned abstracts “to see if the articles fit the domain of our department without using a relevant key word”;
⦁ Excluded articles focused narrowly on information technologies (Information Systems department is considered separate) as well as notes, book reviews, and other short pieces; and
⦁ Generated a list of articles for review (250).
The tables produced by Shane and Ulrich (2004) are identified in the left-hand column of Table 4-10. The results that can be replicated or extended using topic modeling are identified in the right-hand column. Not all the tables generated by Shane and Ulrich can be easily replicated using common and/or open-source topic-modeling software. Below is a comparison of what Shane and Ulrich (2004) generated as compared to what could be generated with the available data and topic modeling tools:
| Table | Shane and Ulrich (2004) | Topic Modeling (Orange/Excel) |
|---|---|---|
| 1 | List of themes and subthemes related to innovation, whether applied to products, technologies, or firms. It includes the creation of products, the commercialization of new technologies, and the birth of new companies. For the themes with substantial prior research or with an established academic structure, identify several subthemes. | List of topics generated utilizing the titles and abstracts of the articles, using topic modeling (LDA) (Table 4-9). |
| 2 | The number of articles published in the field of innovation in each five-year period since the inception of the journal, along with the percentage this number represents of the total number of articles published by the journal overall. | While this would have been possible to complete with a complete data set, the Web of Science database was missing eight years of data. Manual updating is recommended for future research. |
| 3 | Identify the distribution of articles across themes by decade. Identify which themes are more important now than they were when Management Science began and which have become less important. | Identify the distribution of articles – and their relative topic weights – across five decades. Identify which themes are more important now (Figure 4-13, Figure 4-14). |
| 4 | The change in the types of papers published. It shows the percentage distribution of papers across conceptual, formal, empirical, and qualitative by decade. | This could be completed by manually identifying which keywords are related to conceptual, formal, empirical or qualitative, and then comparing to the keywords for each topic; however, this cannot be completed “out of the box” using topic modeling software. This is suggested for future work. |
| 5 | Authorship patterns. | It was not possible to identify authorship patterns using topic modeling. |
To ensure similarity in comparing the results, only those topics that represent 90% of the articles were compared to the topic model. Table 4-11 lists the topics identified by Shane and Ulrich (2004) and the number of articles associated with each topic. The topics that represent 90% of Corpus A are identified.
| Topic | # Articles | % of Total Articles | Top 90% |
|---|---|---|---|
| Adoption and Diffusion of Innovation | 32 | 12.9% | Yes |
| Development Process Management | 31 | 12.5% | Yes |
| Product Planning and Portfolios | 31 | 12.5% | Yes |
| Technology Strategy – Behaviour Studies – Economic Studies – Strategy Process | 18 12 5 | 7.3% 4.8% 2.0% | Yes |
| Basic Research and Advanced Development | 14 | 5.6% | Yes |
| Product Design | 12 | 4.8% | Yes |
| Organization Design – Communication – Decision Making – Organizational Structure | 11 10 7 | 4.4% 4.0% 2.8% | Yes |
| Concept Development | 10 | 4.0% | Yes |
| Public Policy – The Impact of Specific Government Policies – Factors that Account for the Rate of Innovation – The Effect of Innovation on Economic Growth – Tools Used by Policy Makers | 9 5 3 2 | 3.6% 2.0% 1.2% 0.8% | Yes |
| Knowledge Transfer – Knowledge Spillovers and Technology Transfer – Learning | 7 6 | 2.8% 2.4% | Yes |
| Entrepreneurship – Decision Making – Strategy and Performance – Financing – Organization Design | 5 5 4 4 | 2.0% 2.0% 1.6% 1.6% | No |
| Concept Development | 5 | 2.0% | No |
The following is a summary of the descriptions provided by Shane and Ulrich (2004):
| Topic | Summary |
|---|---|
| Adoption and Diffusion of Innovation | “The problem of explaining and predicting the adoption and diffusion of innovation (p. 136).” |
| Development Process Management | Focuses on managing product development processes. “Much of this research takes the perspective of a product development process as a collection of tasks with information flows among them. […] Perennial questions include the extent to which dependent tasks should be overlapped and the relative value of lead time and efficiently (p.136).” |
| Product Planning and Portfolios | Research focused on the question of which innovation projects to pursue. “This decision involves both assessing the inherent merit of a particular project and understanding the interactions among projects in determining the overall value of a portfolio of projects (p. 136).” |
| Technology Strategy n | Behaviour Studies. Behavioral explanations for technology strategy. “Several behavioral studies of technology strategy sought to identify the source of firm performance, but have considered a variety of topics including: creating new knowledge, the strategy-environment fit, intraorganizational relationships, and the effects of top management team characteristics (p. 135).” / Economic Studies. Economic-oriented strategy articles with empirical studies and formal models of technology strategy (p. 135). / Strategy Process. A subtheme of technology strategy research (p. 135). |
| Basic Research and Advanced Development | “These are a highly eclectic group of papers, with no critical mass of work emerging on any particular topic. The topics range from time studies of individual scientists to macro-economic models of R&D spending. […] We draw a distinction between R&D as the product-generation function of the firm and basic research and advanced development, which we define as innovative activities not directed at a specific product-development objective (p. 135).” |
| Product Design | “We define product design as the set of decisions that define the product itself. We exclude from this category a very large body of work on consumer-attribute-based design methods, including conjoint analysis. A body of work has germinated around the issues of coordinating product design with production processes, including papers on design for manufacturing, platform planning, and component sharing (p.136).” |
| Organization Design | Communication. “Communication patterns in innovative activity, which was initially internally focused and shifted to consideration of the external boundary of the organization in the 1980s (p. 135).” Decision Making. Decision making about innovation and technology including process orientation to studies of decision making and formal methods (p. 135). Organizational Structure. Explores the effect of organizational structure on innovation. The earliest subtheme explored in the journal receiving “off-and-on attention over the past 50 years, with the addition of new dimensions periodically reviving the theme (p. 135).” |
| Concept Development | “A central problem in product development is which concept to pursue. The concept is the configuration of working principles and elements that make up the product, whether a service, software, or a physical good (p. 136).” |
| Public Policy | The Impact of Specific Government Policies. “The impact of specific government policies on innovation (p. 137).” / Factors that Account for the Rate of Innovation. “The factors that influence the rate of innovation in a locale (p. 137).” / The Effect of Innovation on Economic Growth. “The effect of technological innovation on economic growth (p. 137).” / Tools Used by Policy Makers. “The tools that policy makers use to make decisions about investments in innovation (p. 137).” |
| Knowledge Transfer | Knowledge Spillovers and Technology Transfer. “Knowledge spillovers and technology transfer. Only since 1999 has this theme been important in the journal (p. 136).” Learning. First published in the 1960s and “expanding the approaches toward learning in a variety of ways (p. 136).” |
Initially, the labels of the topic model were compared to the top 90% of the topics (and subtopics) identified by Shane and Ulrich. The decision to map the topics from the LDA topic model to both topics and subtopics was due to the identification of an alignment between 33% (6/18) of the topics and subtopics (see Table 4-13). In several instances, it was evident that mapping to the topic would be less precise than mapping to the subtopic. The following table was generated:
| Shane and Ulrich (2004) | Topic Model (Orange / Excel) |
|---|---|
| Basic Research and Advanced Development | R&D. |
| Organization Design. Communication. | Communication. |
| Organization Design. Decision Making. | Decision Making. |
| Organization Design. Organizational Structure. | Organizational Structure. |
| Knowledge Transfer. Knowledge Spillovers and Technology Transfer. | Technology Transfer (Universities). |
| Knowledge Transfer. Learning. | Organizational Learning. |
As noted by Jockers (2013), topic labels are often for convenience and may not capture the complexity of a topic; consequently, the descriptions of the topics (and subtopics) were compared. This produced further alignment (1:1) between three topics (17%) but no subtopics; however, the topics of Concept Development (Shane and Ulrich) and Lead Users (topic model) would be considered a partial match as Lead Users is limited to concept development using lead users.
| Development Process Management. Focuses on managing product development processes. “Much of this research takes the perspective of a product development process as a collection of tasks with information flows among them. […] Perennial questions include the extent to which dependent tasks should be overlapped and the relative value of lead time and efficiently (p.136).” | Product Development. The articles associated with this topic discuss product development and associated considerations in the management science. This includes timing for purchasing new products, market timing / entry decision, diffusion theories, development cycles, and associated models. |
| Product Design. “We define product design as the set of decisions that define the product itself. We exclude from this category a very large body of work on consumer-attribute-based design methods, including conjoint analysis. A body of work has germinated around the issues of coordinating product design with production processes, including papers on design for manufacturing, platform planning, and component sharing (p.136).” | Design Performance. This topic discusses measuring product design performance models, looking at heuristics for evaluating optimal product design models. Timing of activities (concurrent, sequential) is discussed. |
| Concept Development. “A central problem in product development is which concept to pursue. The concept is the configuration of working principles and elements that make up the product, whether a service, software, or a physical good (p. 136).” | Lead Users. This grouping of articles discusses the shifting of innovation to users (“lead users”) through market research and toolkits, in addition to testing of new product concepts. [Partial match – limited to concept development with lead users.] |
There were occasions where one topic mapped to several topics and/or subtopics. This would suggest a partial match or overlapping topics. This enabled the mapping of three of the topics (17%) identified by Shane and Ulrich (2004) to topics generated by the topic model:
| Adoption and Diffusion of Innovation. “The problem of explaining and predicting the adoption and diffusion of innovation (p. 136).” | Survival Techniques. This topic discusses what actions must be taken to ensure the survival of a firm. Articles discuss the influence of advertising on product diffusion, the role of contracting in firm survival, and information asymmetry in startups. Explaining Resistance (Individuals). This topic relates to the acceptance of new technology by different individuals, with an emphasis on software adoption by managers. Patents. The articles in this topic are mixed – they discuss the role of patents as well as the adoption of new technologies. |
| Product Planning and Portfolios. Research focused on the question of which innovation projects to pursue. “This decision involves both assessing the inherent merit of a particular project and understanding the interactions among projects in determining the overall value of a portfolio of projects (p. 136).” Public Policy. The Impact of Specific Government Policies. “The impact of specific government policies on innovation (p. 137).” | Resource Allocation for R&D. This topic discusses the allocation of resources for R&D, with a focus on public external funding (incl. federal policies, government seed money, subsidies/entry taxes), private external funding (seed, venture capitalists), and internal funding through product life cycles (product selection choices, R&D models, resource allocation). |
Six topics and subtopics identified by Shane and Ulrich (2004) did not have a clear match in the topic model (33%), while one topic generated by the topic model did not align with any of the topics identified by Shane and Ulrich (2004):
| Shane and Ulrich (2004) | Topic Model (Orange / Excel) |
|---|---|
| Technology Strategy. Behaviour Studies. Behavioral explanations for technology strategy. “Several behavioral studies of technology strategy sought to identify the source of firm performance, but have considered a variety of topics including: creating new knowledge, the strategy-environment fit, intraorganizational relationships, and the effects of top management team characteristics (p. 135).” | (No match.) |
| Technology Strategy. Economic Studies. Economic-oriented strategy articles with empirical studies and formal models of technology strategy (p. 135). | (No match.) |
| Technology Strategy. Behaviour Studies. Behavioral explanations for technology strategy. “Several behavioral studies of technology strategy sought to identify the source of firm performance, but have considered a variety of topics including: creating new knowledge, the strategy-environment fit, intraorganizational relationships, and the effects of top management team characteristics (p. 135).” | (No match.) |
| Technology Strategy. Strategy Process. A subtheme of technology strategy research (p. 135). | (No match.) |
| Public Policy. Factors that Account for the Rate of Innovation. “The factors that influence the rate of innovation in a locale (p. 137).” | (No match.) |
| Public Policy. The Effect of Innovation on Economic Growth. “The effect of technological innovation on economic growth (p. 137).” | (No match.) |
| Public Policy. Tools Used by Policy Makers. “The tools that policy makers use to make decisions about investments in innovation (p. 137).” | (No match.) |
| (No match.) | Evolution of Ideas. The articles associated with this topic discuss how ideas evolve within an organization, with a focus on knowledge within the firm. This includes “tacit knowledge and cumulative learning” as well as the generation of ideas. |
To confirm there was no alignment between the topics identified in Table 4-16, the titles and abstracts associated with each of these topics were reviewed:
⦁ While one of the articles within the Evolution of Ideas topic discusses tacit knowledge and cumulative learning, the primary focus of this topic is the evolution of ideas within an organization. There is no match with any of the topics identified by Shane & Ulrich.
⦁ The topic model did not explicitly identify a topic that would align with Technology Strategy or any of its subtopics (Behaviour Studies, Economic Studies, Strategy Process). The terms “behaviour”, “economic”, and “strategy” do not appear in the top 10 words for any of the topics identified within the topic model for Corpus A.
⦁ The topic model did not explicitly any articles that align with the Public Policy subtopics (Factors that Account for the Rate of Innovation, The Effect of Innovation on Economic Growth, or Tools Used by Policy Makers).
| Shane and Ulrich (2004) | Topic Model (Orange / Excel) | Match | Review | |
|---|---|---|---|---|
| 1 | Basic Research and Advanced Development. | R&D | Yes | Label Only |
| 2 | Organization Design. Communication. | Communication. | Yes | Label Only |
| 3 | Organization Design. Decision Making | Decision Making | Yes | Label Only |
| 4 | Organization Design. Organizational Structure. | Organizational Structure. | Yes | Label Only |
| 5 | Knowledge Transfer. Knowledge Spillovers and Technology Transfer. | Technology Transfer (Universities). | Yes | Label Only |
| 6 | Knowledge Transfer. Learning. | Organizational Learning | Yes | Label Only |
| 7 | Development Process Management | Product Development. | Yes | Label & Description |
| 8 | Product Design. | Design Performance. | Yes | Label & Description |
| 9 | Concept Development. | Lead Users | Partial | Label & Description |
| 10 | Adoption and Diffusion of Innovation. | Survival Techniques. Explaining Resistance (Individuals). Patents. | Partial Partial Partial | Label & Description Label & Description Label & Description |
| 11 | Product Planning and Portfolios. | Resource Allocation for R&D. | Partial | Label & Description |
| 12 | Public Policy. The Impact of Specific Government Policies. | Resource Allocation for R&D. | Partial | Label & Description |
| 13 | Technology Strategy. Behaviour Studies. | (No Match.) | None | Label & Description, Abstracts |
| 14 | Technology Strategy. Economic Studies. | (No Match.) | None | Label & Description, Abstracts |
| 15 | Technology Strategy. Strategy Process. | (No Match.) | None | Label & Description, Abstracts |
| 16 | Public Policy. Factors that Account for the Rate of Innovation. | (No Match.) | None | Label & Description, Abstracts |
| 17 | Public Policy. The Effect of Innovation on Economic Growth. | (No Match.) | None | Label & Description, Abstracts |
| 18 | Public Policy. Tools Used by Policy Makers. | (No Match.) | None | Label & Description, Abstracts |
| – | (No Match.) | Evolution of Ideas. | None | Label & Description, Abstracts |
The above comparison suggests that if we compare Shane and Ulrich’s topics to those of the topic model, there was a full match for eight topics (44%), partial match for four topics (22%) while six of the topics (33%) identified by Shane and Ulrich could not be mapped. Examined another way, 13 out of the 14 topics generated by the topic model (93%) were a full or partial match with topics and/or subtopics identified by Shane and Ulrich (2004).
Discussion
Distribution of Articles Across Years
The table generated by Shane and Ulrich (2004) identified the publications per decade:
| 1954 | 1964 | 1974 | 1984 | 1994 | ||
| The role of the individual | 0 | 1 | 2 | 1 | 1 | |
| Organization design | 0 | 4 | 11 | 6 | 8 | |
| Basic research and advanced development | 1 | 2 | 3 | 6 | 2 | |
| Technology strategy | 0 | 0 | 3 | 20 | 11 | |
| Knowledge transfer | 0 | 1 | 1 | 2 | 9 | |
| Product planning and portfolios | 0 | 7 | 14 | 9 | 2 | |
| Development process management | 0 | 3 | 1 | 5 | 22 | |
| Product design | 0 | 0 | 0 | 2 | 9 | |
| Concept development | 0 | 0 | 2 | 2 | 7 | |
| Adoption and diffusion of innovations | 0 | 4 | 7 | 13 | 8 | |
| Public policy | 0 | 4 | 6 | 4 | 5 | |
| Entrepreneurship | 0 | 1 | 0 | 7 | 10 | |
A similar table with additional granularity is possible using the automated methods once the topics has been established. By identifying the primary topic for each article in the topic model, the researcher can then select the level at which they with to review the data – low-level (publications per year) or in aggregate (publications per decade). While this table could be generated manually, the benefit of a semi-automated method is realized with a larger corpus that can classify the articles in a fraction of the time.
Evolution of Topics over Time
In their article Technological Innovation, Product Development, and Entrepreneurship in Management Science, Shane and Ulrich (2004) discuss the evolution of the themes using descriptive text, based on their expert (manual) review. Additional insights can be generated using topic modeling; the researcher can identify the average topic weights by year and generate a topic evolution graph (see Figure 4-14). This can be used in conjunction with descriptive text; however, this additional level of granularity is not available in a manual review.
Topic Comparison Alignment
The process of mapping of the new LDA topics to the pre-existing topics is similar to the process followed by Neuhaus & Zimmerman (2010), who also identified that while the model showed some alignment, not all topics were assigned to the pre-existing model (or vice versa). The authors indicated that an LDA topic might not coincide naturally with a pre-existing list of topics; however, this is not necessarily a problem for topics generated using LDA as partial assignments are possible (i.e., a document can be a mixture of multiple topics in different percentages) (Neuhaus & Zimmerman, 2010). While they successfully mapped 50% of the LDA topics directly to pre-existing topics, this model mapped upwards of 93% of the LDA results to pre-existing topics. As these results are sufficiently comparable to other studies, it was deemed acceptable to proceed to the analysis of Corpus B.
Management Science (2005-2015)
Generate Topic Models
Data Acquisition
For Corpus B (2005-2015) the authors name, article publication year, title, abstract, and keywords were collected from the Web of Science database and consolidated into a CSV file. To achieve this result, multiple steps were required (see Annex B for details).
Data Preprocessing
All non-journal articles were removed (ex. introductions to special editions, editor’s notes, erratum, etc.). Other unusual entries were manually reviewed (see Annex B for examples). To do so, the top pane was frozen and the filter functionality was used to identify outliers or unusual results. The result was a list of 1625 articles published in Management Science between 2005-2015.
Generation of Topic Models
In Orange, Corpus B was used to generate multiple topic models, with varying numbers of topics in increments of 5 (5, 10, 15, 20, 30, … 50).
Selection of Optimal Topic Model
Overall Importance of Topics
As per the process outlined for Corpus A, the overall importance was calculated by selecting the topics that explain 90% of the papers. The following charts were generated:
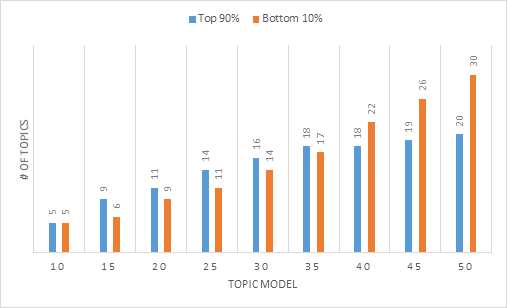

Analysis: When reviewing the percentage of topics that represent 90% of the journal articles, the total number of topics that includes the 90% of the articles appears to stabilize at 18 topics in Topic Models 35 and 40 (Figure 5-1). When comparing the number of topics that cover 90% of the articles to the total number of topics in a model, there is a sharp drop between Topic Model 35 and 40 (>6%).
Next Steps: The topics that represented less than 10% of the total topics were removed from each model. Topic models with 35 and 40 were identified as possibilities for further consideration
Coherence
The topics were reviewed for coherence and assigned as score of high, medium, or low cohesion. This identified the model with the highest number of cohesive terms, both in terms of those labeled as “high” as well as the combined score for “high” and “medium”.
Output: The following charts were generated:
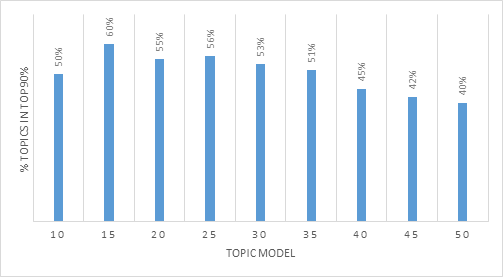
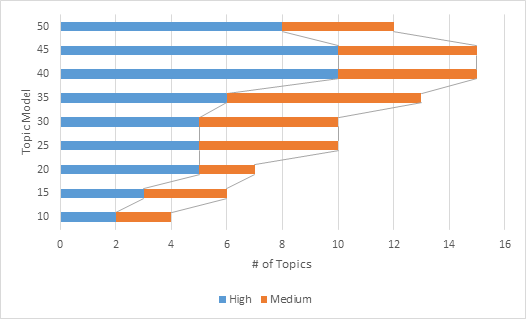
>Analysis: In reviewing the above chart, Topic Models 40 and 45 have the highest proportion of medium- and high-coherence topics; however, the topics models need to be evaluated further to determine which topic model to select.
Recurring Topics / Keywords
The topic modeling software generates a list of the top 10 terms associated with each topic. If there are topics that appear repeatedly across multiple topic models, this would suggest that the topic is a relatively stable one. The following charts were generated:
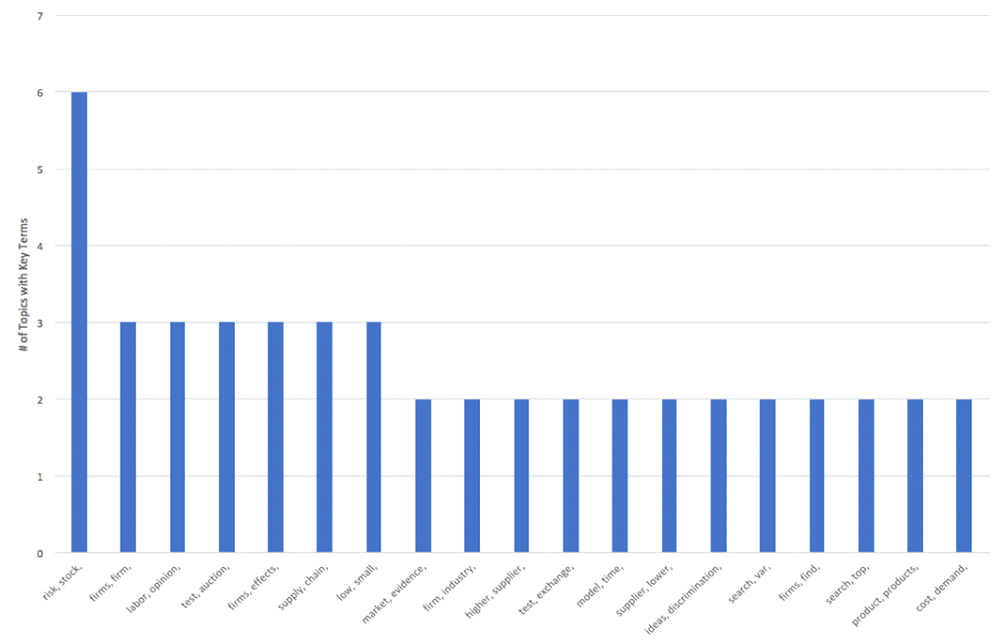
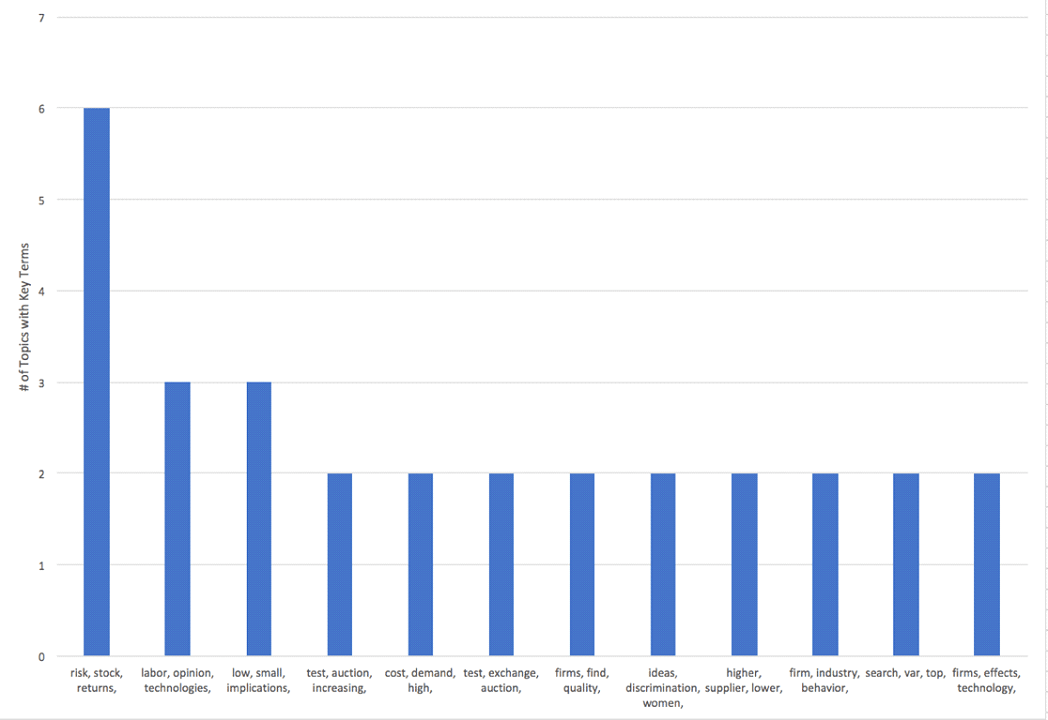
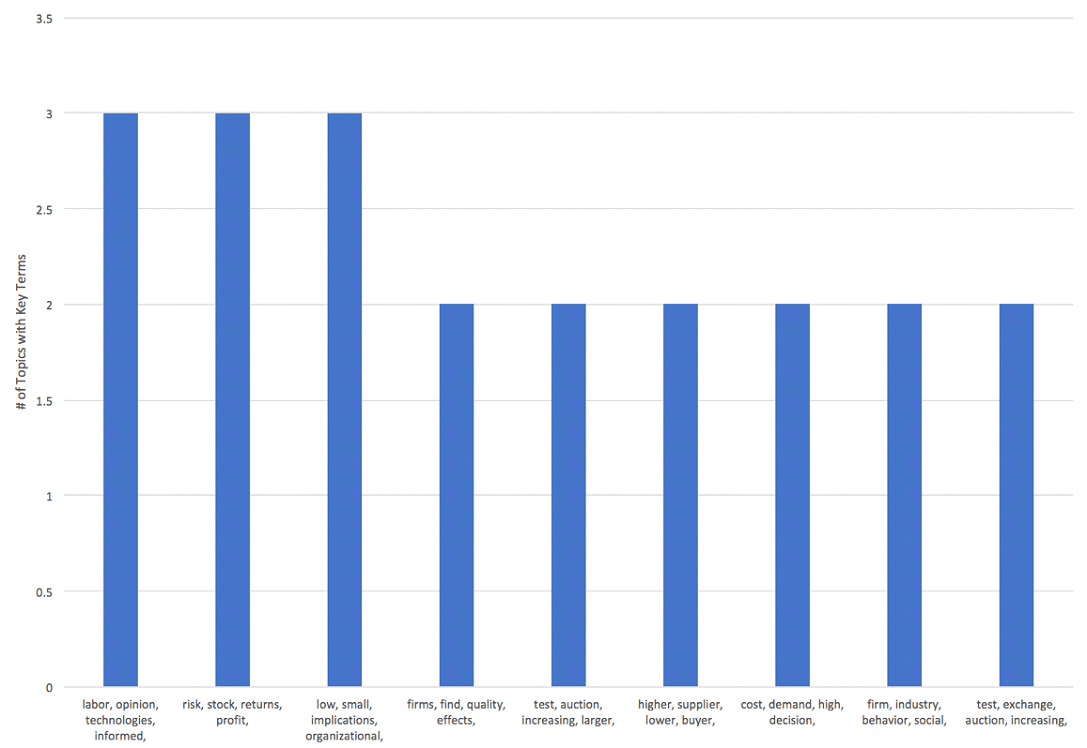
Once the scope was limited to three headwords, overlap began to occur (ex. test, exchange, auction, increasing vs. test, auction, increasing, larger). Once four headwords were included, there were three clear topics identified: Labor/Opinion, Stock Risk, and Low/Small (see Figure 5-7). It is reasonable to conclude that a stable topic model will include the highest number of recurring topics. The final model should include all the following topics: Labor, Stock (Risk / Return), Organizational, Firms, Auctions, Supply / Demand.
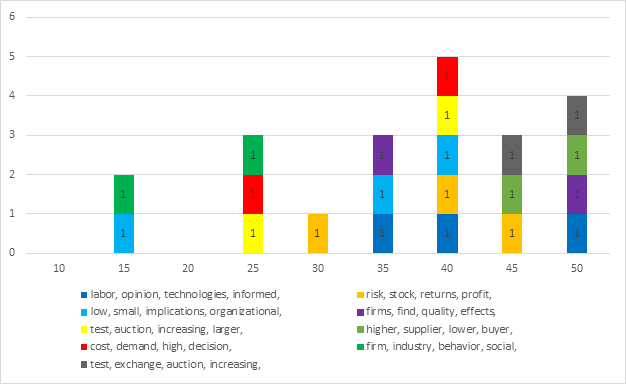
In reviewing the Figure 5-8, Topic Model 40 has the most duplicate topics (5). While topic model 50 has four recurring topics, it does not meet the criteria set out in the previous two sections: (a) overall importance and (b) coherence and cohesiveness. All other topic models with three duplicate topics (25, 35, and 45) are likewise excluded. Topic Model 40 was selected for further review.
Labeling Topics (Initial Interpretation)
Topic Headwords
The resulting list of topics were organized in terms of topic weight from highest to lowest (top to bottom) and words organized from most to least relevant (left-to-right).
| Topic | Rank | ||
|---|---|---|---|
| 33 | 1 | Implements LDA using Gibbs Sampling | firms, firm, product, |
| 21 | 3 | time, industry, behavior, customers, findings, design, associated, consumer, effort, acquisition | time, industry, behavior, customers, |
| 19 | 4 | price, model, data, customer, consumers, flexibility, process, choice, benefits, number | price, model, |
| 1 | 5 | risk, stock, returns, profit, term, sales, strategy, positive, investors, volatility | risk, stock, returns |
| 7 | 7 | investment, trust, production, group, conditions, options, randd, aversion, incentive, contracts | investment, trust, production |
| 5 | 8 | higher, impact, supplier, lower, buyer, ability, role, profits, future, contract | higher, impact, supplier, |
| 36 | 9 | low, small, implications, organizational, distribution, effectiveness, policy, knowledge, types, loss | low, small, implications, organizational, |
| 20 | 10 | test, auction, increasing, larger, auctions, bidders, goods, price, user, multiple | test, auction, |
| 33 | 1 | Implements LDA using Gibbs Sampling | cost, demand, |
| 30 | 11 | social, increase, incentives, network, capacity, sharing, period, mechanism, advantage, retention | social, increase, |
| 12 | 12 | supply, chain, relative, examine, suppliers, second, stage, queue, inventories, power | supply, chain |
| 28 | 15 | labor, opinion, technologies, informed, practices, compensation, skills, American, shaped, professionals | labor, opinion, technologies, |
| 13 | 16 | ideas, discrimination, women, inspection, adjustments, takers, male, idea, voting, prescriptive | ideas, discrimination, women, |
| 17 | 17 | vendor, platform, piracy, versioning, promotion, intellectual, video, growing, senior, placement | vendor, platform, |
| 22 | 18 | liability, sector, peers, populations, science, performing, scientists, nonmonetary, cooperation, manipulation | liability, sector, peers, |
Analysis: After reviewing the above table, the following tentative labels were generated:
(Generated in Excel) | (Human Readable) | |
|---|---|---|
The above labels appear reasonable when reviewed in table format; however, some of the terms have little meaning when viewed in isolation or as part of a ten (10) word summary. What is meant by Organizations, Firms/Products, and Labor and Technology? There is insufficient context to determine what is meant by some of these terms. Additional review is required for identified terms, using more detailed tools (word clouds, titles/abstracts).
Word Clouds
To assist with the interpretation of each of these topics, word clouds were generated to see if additional context could be inferred from the images.
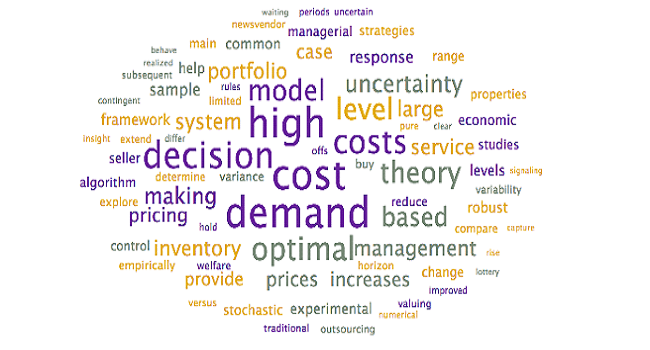
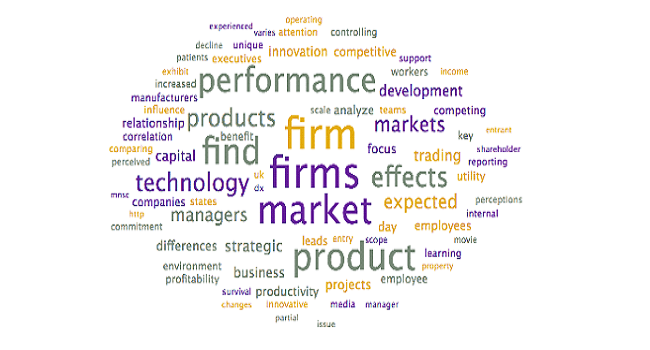
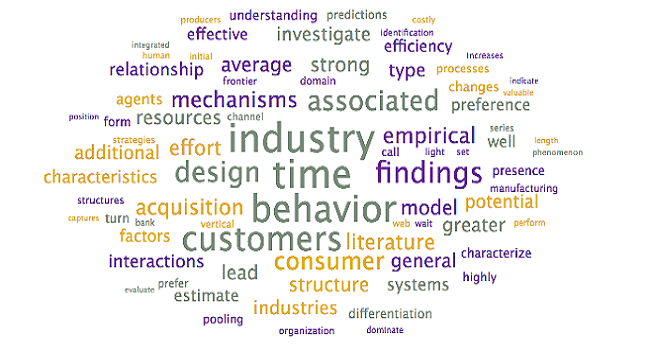
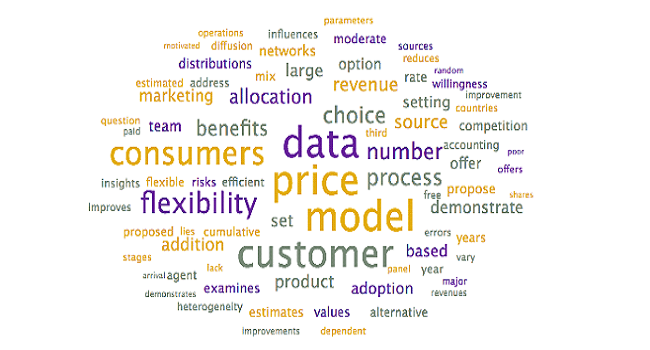
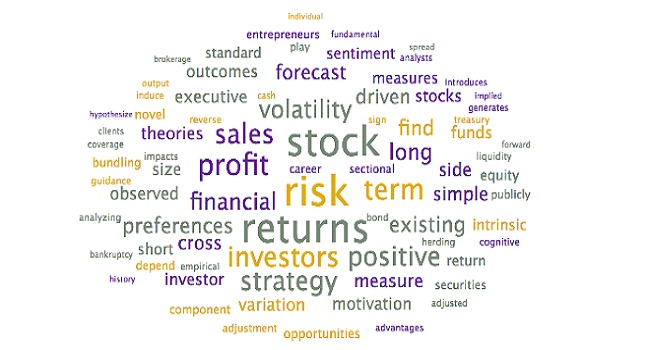
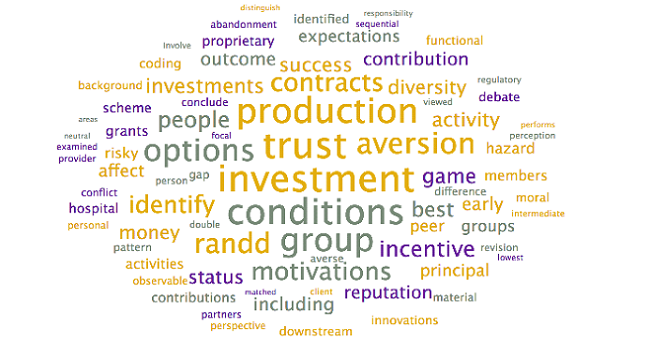
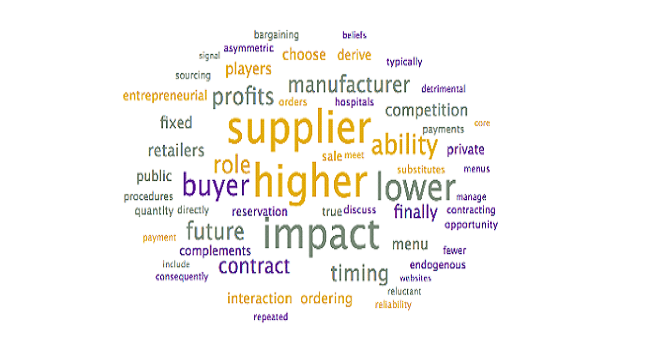
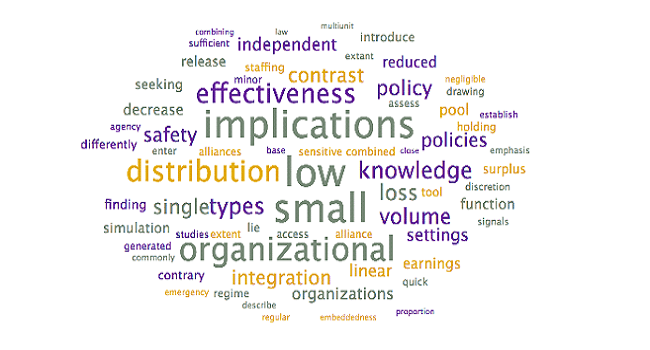
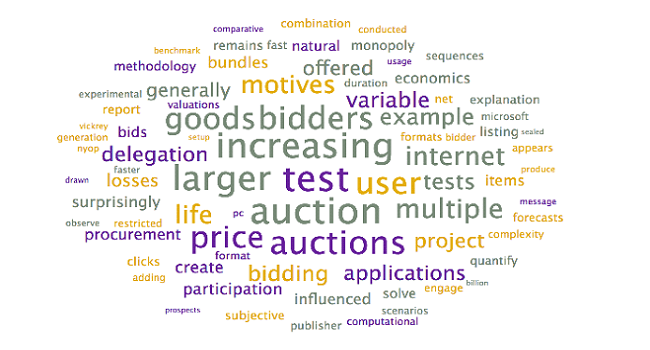
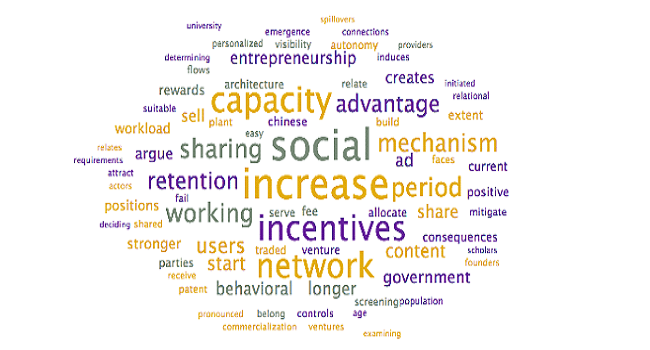
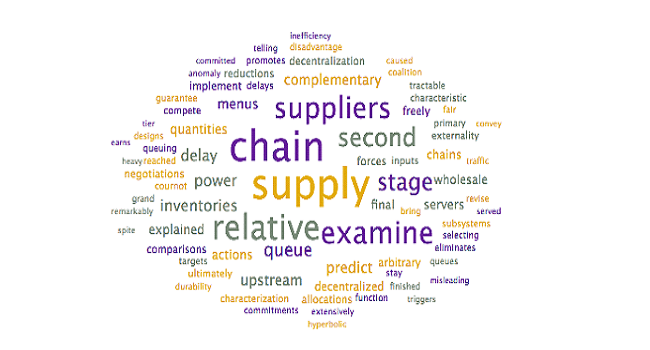
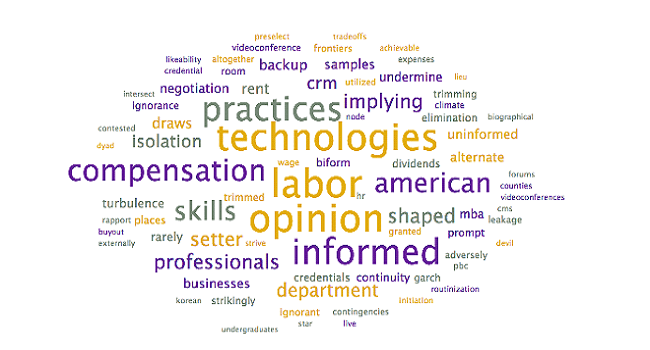
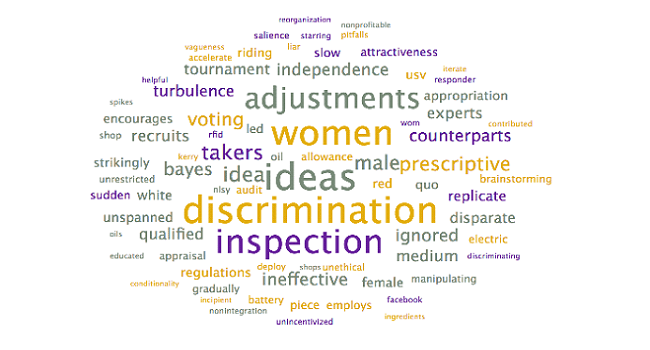
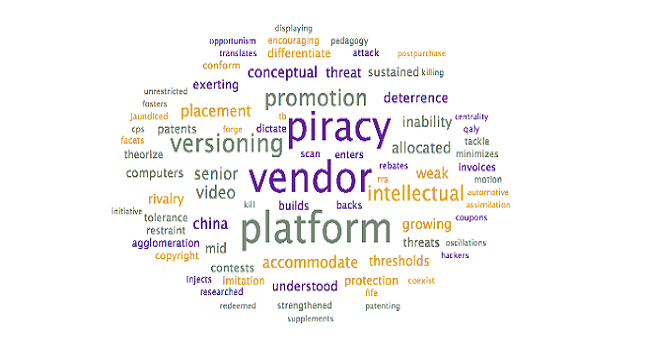
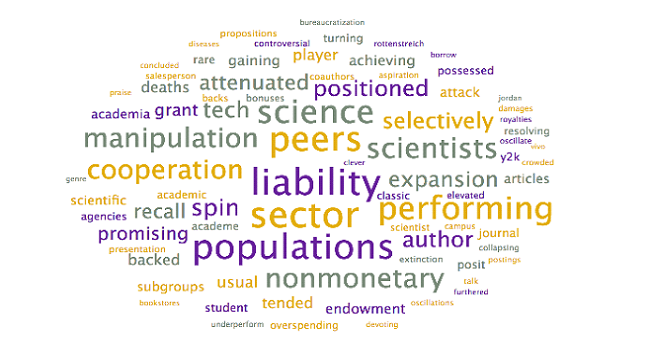
Analysis: After reviewing the word clouds, the topic labels were updated to the following:
(Generated in Excel) | (Human Readable) | (Word-Clouds) |
|---|---|---|
Review of Abstracts and Titles
A final verification is to review the abstracts and titles associated with each topic was conducted, to determine if there are more appropriate labels and whether they have been classified correctly. The following table was generated:
| Row Labels | Count of Highest | Percentage of Total |
|---|---|---|
| Decision Models | 447 | 28% |
| Decision Models | 447 | 28% |
| Firms / Products | 310 | 19% |
| Customer Behavior | 447 | 28% |
| Decision Models | 170 | 10% |
| Stocks (Risk / Return) | 447 | 28% |
| Decision Models | 137 | 8% |
| Pricing Model | 128 | 8% |
| Auctions | 37 | 2% |
| Investments | 34 | 2% |
| Supply Chain | 32 | 2% |
| Decision Models | 447 | 28% |
| Suppliers | 29 | 2% |
| Social Networks | 27 | 2% |
| Organizations | 19 | 1% |
| Discrimination | 14 | 1% |
| Academic Peers | 11 | 1% |
| Platform | 10 | 1% |
| Technology Labor | 7 | 0.4% |
| Grand Total | 1407 | 87% |
With 447 of the articles associated with Decision Models, this represents over 27% of the articles in Corpus B. The second highest topic is Firms / Products, representing just over 19% of the articles in Corpus B. The combined total of these two categories is less than 47% of the articles in the journal. As these are not weighted as heavily towards two topics (as they were in Corpus A, where >60% of the articles were represented by two topics), a secondary review to confirm allocation was not performed prior to analyzing the titles and abstracts.
After reviewing the titles and abstracts for the top articles for each topic, the following observations were made:
⦁ Decision Models. The top 34 articles (0.40-0.73 / 447 / 8%) discuss various decision models, methods, and algorithms used by organizations in a variety of industries (call centers, manufacturing environments, etc.). A sampling of lower-weighted articles confirms the focus on optimization using various models.
⦁ Firms / Products. The top 28 articles (0.35-0.69 / 310 / 9%) discuss innovation (business process, product, disruptive, technological), R&D, new product development, market entry, and the role of employees as sources of knowledge and innovative ideas. There is limited discussion of learning curves and firm survival. After reviewing the word cloud, the label of Firm and Product Performance would be appropriate, as each of the articles discusses the overall performance of either the firms or products.
⦁ Customer Behavior. As suggested by the current label, the articles discuss the impact of customer behavior in various situations. The top 16 articles (0.35-0.78 / 170 / 9%) are subdivided into discussions of call centers and communications networks (5 articles) and consumer choices (6 articles), with several recurring sub-themes (ex. website design, brand preference, queues).
⦁ Stocks (Risk / Return). The top 25 articles (0.35-0.86 / 137 / 18%) all relate to this topic clearly, through discussions of analysts’ forecasts, investors, capital asset pricing, mutual funds, bonds, private equity, and stocks. This is a cohesive topic, but it is broader than “risk / return” – suggested new label is Stock Market.
⦁ Pricing Model. Of the top 18 articles (0.35-0.69 / 125 / 14%), the majority (>14) discuss “choice” or “decisions” in conjunction with relevant models (“choice models” / “modeling choice”) with a focus on consumer decisions. Price discrimination is discussed in several articles and pricing is identified as a variable in select models. After reviewing the tiles and abstracts in conjunction with the word cloud, a more appropriate label would be Consumer Choice Models. Interestingly, it was determined this topic appeared as the second-highest-weighted topic for 87 of the Decision Models articles (87 / 447).
⦁ Auctions. Of the top 8 articles (0.33-0.56 / 37 / 22%), seven relate to online auctions and bidding. The articles investigate auctions in different contexts, including emotional bidding, charity auctions, procurement, and combinatorial bidding. The outlier article Accelerated Learning of User Profiles addresses targeted online ads. It’s unclear why this was the second-highest-ranked article. The majority of the articles are published in 2005 (11/37) and again in 2015 (6/37), with the focus in the former year on online auctions and individual users and the latter focusing on public procurement auctions.
⦁ Investments. The top 9 articles (0.26-0.64 / 34 / 26%) discuss collaboration between individuals and organizations (incl. contract laws, partnership formation, and morality) with an emphasis on the decisions made in investment groups and intergroup competition. When compared to the original word cloud “group” and “conditions” appear as prominently as the term “investments”. As such, an alternative label for this topic is Group Conditions.
⦁ Supply Chain. Of the top 10 articles (0.25-0.54 / 32 / 31%), 90% discuss supply chain considerations including the “bullwhip effect” except one article. The outlier article Back to the St. Petersburg paradox? has an extremely short abstract, with no words that clearly align with the supply chain concept. It’s unclear why it was allocated to this topic. A quick review of articles with lower topic weights implies a cohesive topic.
⦁ Suppliers. Of the top 7 articles (0.28-0.64 / 29 / 24%), 86% of articles discuss the challenges associated with buyer – supplier relationships (with a focus on information asymmetry). The outlier article When Smaller Menus Are Better: Variability in Menu-Setting Ability appears to have some of the key terms associated with this topic (i.e., “informational limitations”). Interestingly, only three of the 29 articles associated with this topic have “Supply Chain” as the secondary topic.
⦁ Social Networks. Of the top 7 articles (0.30-0.54 / 27 / 26%), the term network appears in three of the articles, but in different contexts: communications network, global manufacturing network, and online social network. Other articles use related terms (ex. “socially constructed confidence”) but do not discuss networks. Lower-weighted articles discuss social processes, social capital, social contagion, social proximity, social comparison, and using the firm as a socialization device. The original, general label of Networks is preferable.
⦁ Organizations. Of the top 7 articles (0.24-0.57 / 19 / 28%), five discuss joint ventures, disclosure of information, and collaboration. The others focus on moral hazard in accounting literature and managing processes in a call center. Lower-weighted articles also focus on two sub-topics: knowledge sharing and accounting (the articles regarding accounting also discuss the use of knowledge in decision making). In re-reviewing the word cloud, a suggested new topic label is Organizations & Knowledge.
The following topics represented less than 1% of the total articles per topic. A preliminary review was completed to determine if it was appropriate to include these topics in the final model and determine if these are cohesive topics, based on a review of the titles and abstracts:
⦁ Discrimination. Due to the small size, all 14 of the articles and abstracts were reviewed. This appears to be two topics: gender studies (6 articles), research into electric vehicles and carbon capture (4 articles), and crowdsourcing ideas (3 articles). As this is not a cohesive topic representing less than 1% of the articles, it will be removed from the final model.
⦁ Academic Peers. Of the top 4 articles (0.25-0.30 / 11 / ), three discuss science or scientists. The second-highest-weighted article, Multiple-Unit Holdings Yield Attenuated Endowment Effects, seems to have no relationship to the other articles. The remaining articles vary in terms of the content. This is not a cohesive topic.
⦁ Vendor Platform. Of the top 5 articles (0.20-0.24 / 10 / 50%), three discuss software platforms. The balance of the articles discuss other concepts not necessarily related to platforms. This is not a cohesive topic.
⦁ Technology Labor. Of the top 4 articles (0.20-0.30 / 7), only the highest-weighted article discusses IT professionals, the remaining three articles discuss more general labor topics. This should be renamed Labor.
As a result of this review, the following modifications to the topic labels and topic model are proposed (presented in order from left to right, original label to current label):
(Generated in Excel) | (Human Readable) | (Word-Clouds) | (Title/Abstract Review) |
|---|---|---|---|
(Men/Women) | (Men/Women) | ||
Final Topic Model: Description and Visualization
The final topic model for Corpus B will contain 11 topics, as follows:
| Topic Label | # of Articles | Years Covered | % of Total | Description |
|---|---|---|---|---|
| Decision Models | 447 | 2005-2015 | 28% | These articles discuss decision models, methods, and algorithms used by organizations in a variety of industries for optimization. |
| Firm and Product Performance | 310 | 2005-2015 | 19% | These articles discuss discusses the overall performance of firms and product performance, with a focus on innovation (business process, product, disruptive, technological), R&D, new product development, market entry, and the role of employees as sources of knowledge and innovative ideas. |
| Customer Behavior | 170 | 2005-2015 | 10% | These articles discuss the impact of customer behavior in various situations, with an emphasis on call centers and electronic channels. Sub-themes include website design, brand preference, and queues. |
| Stock Market | 137 | 2005-2015 | 8% | These articles discuss the various aspects of the stock market, including analysts’ forecasts, investors, capital asset pricing, mutual funds, bonds, private equity, and stocks. |
| Consumer Choice Models | 125 | 2005-2015 | 8% | These articles discuss consumer choice models, including price discrimination. |
| Auctions | 37 | 2005-2015 | 2% | These articles discuss online auctions and bidding for both individual users as well as for public procurement. Subtopics include emotional bidding, charity auctions, and combinatorial bidding. |
| Group Conditions | 34 | 2005-2015 | 2% | These articles discuss collaboration between individuals and organizations (incl. contract laws, partnership formation, and morality) with an emphasis on the decisions made in investment groups and intergroup competition |
| Supply Chain | 32 | 2005-2015 | 2% | These articles discuss supply chain considerations including the “bullwhip effect.” |
| Suppliers | 29 | 2005-2015 | 2% | These articles discuss the challenges associated with buyer – supplier relationships, with a focus on information asymmetry. |
| Networks | 27 | 2005-2015 | 2% | These articles discuss different types of networks, including communications networks, global manufacturing networks, and online social networks. It also discusses interpersonal networks via social processes, social capital, social contagion, social proximity, social comparison, and using the firm as a socialization device. |
| Organizations & Knowledge | 19 | 2005-2015 | 1% | These articles discuss organizations and the transfer of knowledge via joint ventures, disclosure of information, and collaboration. |
Distribution of Articles Across Topics by Year
This chart shows the distribution of articles across themes by year:

The following is observed in relation to the distribution of articles across topics by year:
⦁ Articles discussing Decision Models decreased over the course of the 10-year period, from 55 articles down to 35 articles. At the lowest point there were only 29 articles published on this topic (2001).
⦁ Firm & Product Performance fluctuates between 24 and 38 articles published, with two years having significantly fewer articles (18 in 2005 and 19 in 2012).
⦁ Customer Behavior appears to peak 2008 with 22 articles published, although equally high numbers are observed in 2009 and 2011 (18 and 19 articles, respectively). Prior to those years, there were as few as 11 publications (2005).
⦁ Articles discussing the Stock Market are relatively stable between 2005 and 2010 with between 6 and 10 articles published on an annual basis. The articles then increase nearly twofold between 2011 and 2012 (nearly doubling from 10 to 19 articles) and then increase further to 27 articles in 2014, before dropping to 20 articles in 2015.
⦁ Consumer Choice Models also has a large degree of variability, fluctuating between 5 and 19 articles published on an annual basis. The years with the highest number of publications – 2014 and 2015 – have 19 and 18 articles published respectively, a nearly twofold increase over 2012 and 2013. A similar peak is observed in 2010 with 17 articles.
⦁ The topic of Auctions shows an interesting trend: in 2005 there are 11 articles published, primarily focusing on online auctions for consumers. There is a dramatic drop in the years between 2006 and 2013, but then increases in 2014 and 2015 to 4 and 6 articles, respectively. The articles published in these later years focus primarily on a different type of auction: public procurement auctions.
⦁ Group Conditions have 5 articles published in 2005 and 2015 and 6 articles published in 2012, while the intervening years have as only 2 to 3 articles published. No articles appear in 2008.
⦁ Supply Chain peaks in 2008 and 2009, then decreases in the years up to 2014, with no articles published in 2015.
⦁ Suppliers fluctuates between 1 and 4 articles, with a maximum of six published in 2006.
⦁ Networks peaks in 2006 and 2014 with 5 articles published. The next highest years our 2013 with 4 articles published; all other years have three or less articles.
⦁ Organization & Knowledge has a peak year in 2005, after which point there are few articles published until 2010 when there are three articles published. This topic disappears in 2013, but increases dramatically between 2014 and 2015 to include three articles published
Evolution of Topics Over Time
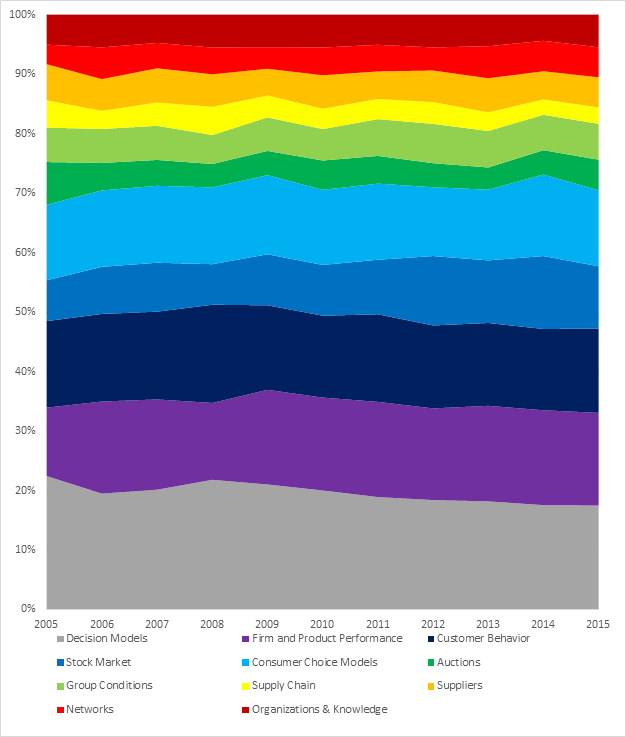
At a glance, the distribution of topics is relatively stable between 2005-2015. While there is some variation in terms of the overall percentage of any given topic (between 5% and 7%) there are no dramatic changes. Decision Models shows a decrease of about 6% over the period while Firm Product and Performance shows a small increase over the same (9.3% to 11.9%). Customer Behavior is relatively stable throughout (11.7% to 10.8%), as is Group Conditions (between 3.8% and 4.6%), and Suppliers (3.5% to 4.9%). Consumer Choice Models only varies by 0.4% (9.6% to 10%), and Organizations & Knowledge is stable at ~4%. Stock Markets fluctuates between 5.5 to 8.7%, Supply Chain between 1.9% to 3.7%, and Networks between from 2.6% and 4.1%. Auctions drops from 5.8% to as low as 2.8%, but otherwise remains around 3.5%.
Comparison: Corpus A to Corpus B
In the previous chapter, the results of Corpus A were compared to an expert review. The reasons for the alignment and the differences were discussed. For the purposes of discussion, the results of Corpus A will be compared to Corpus B.
| Product Development | Decision Models |
| R&D | Decision Models |
| R&D | Firm and Product Performance |
| Resource Allocation for R&D | Customer Behavior |
| Decision Making | Stock Market |
| Design Performance | Consumer Choice Models |
| Survival Techniques | Auctions |
| Patents | Group Conditions |
| Evolution of Ideas | Supply Chain |
| Technology Transfer (Universities) | Suppliers |
| Communication | Networks |
| Organizational Learning | Organizations & Knowledge |
| Explaining Resistance (Individuals) | |
| Organizational Structure | |
| Lead Users |
Data Set. While Corpus A was already a refined list of articles produced by two expert reviewers, Corpus B was an unrefined list that included all articles published between 2005 and 2015. There is no statistically significant increase or decrease for a single topic identified in the Corpus B topic model; by contrast, Corpus A shows dramatic differences in the percentage of each topic per year, with significant fluctuations for several different topics. Given the level of granularity in Corpus A, it is perhaps unsurprising that some topics are shown to dramatically increase while others and decrease over the 50-year period. The same degree of granularity is not present in Corpus B; instead, the result is a set of high-level general groupings based on key topics, from which an individual can conduct a further (manual) review.
Time Period. A second variable is the time periods for the two corpora. Corpus A is a relatively small set of articles (248) that covers over 50 years of a Management Science; as such, it would be expected that if there are no publications for several years it will have a greater impact on the average topic weight per year. Corpus B only covers a 10-year period, but has nearly 10 times as many articles (1625); if there is a change in terms of only a few articles (increase or decrease) it will not have as dramatic and effect on the average topic weight per year. Further, in an established academic journal, this may not be sufficient time to show a dramatic increase or decrease in one topic area, particularly when the selected topics are very broad.
Methodology. The above highlights the differences in the methodology as well: an expert pre-selected the subset of articles based on keywords and experience, but by using topic modeling, a researcher can use the topics in the topic model to determine a subset of articles for further review.
As noted above, a comparison between these two corpora is interesting, but alignment is not expected due to the differing sizes of the corpora, level of granularity, and years the data spans.
Discussion
Contributions
A replicable process using open-source topic modeling software that had not previously discussed in topic modeling literature was developed and used to evaluate a pre-existing corpus (Corpus A) as well as a new corpus (Corpus B). The first topic model (Corpus A) was compared against a pre-existing expert review prior to using the process to analyze a significantly larger dataset (Corpus B). As a result of this work, three contributions were made:
⦁ New insights were generated in relation to the evolution of topics over time within Management Science (Chapter 4 & 5);
⦁ A replicable process for topic modeling that that be used by non-technical researchers was developed (see Annex A); and
⦁ Insights regarding the use and limitations of an open-source topic modeling tool in conjunction with a popular electronic spreadsheet software application were generated.
This section discusses the contributions of this research and provides recommendations for practitioners
New Insights
By utilizing topic modeling, additional insights regarding the evolution of topics within a pre-existing corpus (Corpus A) from Management Science (Shane and Ulrich, 2004) and an expanded corpus (Corpus B) have been generated. This included insights regarding the breakdown of topics published as well as additional granularity with respect to the relative weighting of each topic per year. Insights generated from each of the corpora include:
⦁ Corpus A: 1954-2004. As previously noted in Chapter 4, the high-level results from applying the topic modeling process to Corpus A are substantially similar to those generated from the manual review conducted by two editors of Management Science. While there are some topics with no clear match, overall there was sufficient similarity to indicate that the topic modeling software generates results that are in-line with those of an expert review. Reasons for some of the discrepancies included: inconsistency of the data in the original data set, varying experience of the reviewers (topic experts vs. graduate student), as well the unbiased nature of topic modeling.
⦁ Corpus B: 2005-2015. The results from Corpus B are in line with in line with what is expected from the topic modeling tool: a preliminary grouping of articles by topic, from which the researcher can conduct further (manual) analysis. There were some articles that didn’t appear to explicitly match the topic; this could due to the presence of latent themes that a human reviewer cannot interpret. The conclusion that can be drawn from reviewing the results of the topic modeling process as applied to Corpus B is that the semi-automated methods are useful for generating general classifications of the content, but should not be viewed as an absolute means of analyzing and classifying content.
Each of the topic models generated are only one potential frame for viewing the data. Other researchers may find a different topic model more suitable for their needs: a different level of detail may be achieved by increasing or reducing the number of topics (DiMaggio, Nag & Blei, 2013).
Replicable Process
Selection of Topic Model. The initial process used to generate the results was conceptualized as a result of the literature review; however, throughout the course of this research heuristics were added as required. Initially, only two heuristics were used for selecting the topic model: overall importance and coherence. While these generated clear results for Corpus A, these two heuristics were insufficient when applied to Corpus B. The heuristic that identified duplicate or recurring keywords between the models was inspired by Amin (2016), but implemented using pivot tables and the TRIM functionality in Excel. This heuristic generated a decisive answer for which topic model should be used in Corpus B. To verify its accuracy, it was retroactively applied to Corpus A, where it confirmed the original selection of Topic Model 30.
This “tiebreaker” heuristic would not have been considered if the first two heuristics had been sufficient; however, by repeating the process on a separate corpus the limitations of the initial process were identified. Applying it retroactively to Corpus A – and discovering that it aligned with the pre-existing results – verified that this was a necessary and accurate heuristic.
Generation of Topic Labels. While other authors have argued that the topic labels are only for ease of being able to refer to the topics by something other than the arbitrarily assigned numbers (Jockers, 2013), the exercise of reviewing the headwords, word clouds, as well as the titles and abstracts for the highest-weighted articles invariably leads to a deeper understanding of the material. This is helpful for gaining a high-level understanding of the topic prior to an in-depth, manual review of selected topics. While a researcher with limited time could theoretically skip some of these steps, the use of all three will ensure that the selected topic model will be appropriate for their purposes.
Speed of Analysis. The generation of a reproducible process during the review of Corpus A enabled the review of Corpus B to be conducted significantly faster (roughly 1/10th the speed of the initial analysis) even though Corpus B was 6.5 times the size of Corpus A. The iterative development of this process also allowed the researcher to become intimately familiar with the software, identifying a list of areas where additional development of analytical tools would further expedite the semi-automated topic modeling process.
The information regarding the process is contained both within the body of this document, as well as through additional screenshots included in Annex A & B.
Limitations of select semi-automated methods
Further, through the development of the above-mentioned process, additional insights regarding the selected software were generated. While developing a workflow using the Graphical User Interface was relatively straightforward as no command-line programming experience is required, no analytical capabilities are available in the open-source topic modeling tool (e.g. no ability to rank topics and analyze temporal evolution of topics). The inability to perform any analysis within the selected topic modeling tool (Orange) forces the researcher to use a secondary tool for analysis (Excel). The inclusion of basic heuristics such as selecting the top weighted topics by average topic weight and being able to identify cohesion within the software tool would be preferable.
Additionally, the ability to save the results of either the topic models or heuristics (if implemented) would be useful, as it is not possible to save critical information (i.e., unable to save topic models for later use). Further, it was determined that word clouds must be saved at the time of generating the topic model as they could not be created retroactively using Orange. A workaround was created by converting the saved topic model excel files into a TAB format that could be re-imported into Orange and processed using the Python script module. While the word clouds for Corpus A were generated using the workaround, it would be preferable if there were an easier way of saving the word clouds – preferably in batches, as opposed to saving the word cloud for each topic individually.
Limitations of Research
This research was limited based on three key factors: quality of the source data, the selection of the analysis techniques, and the researchers’ expertise.
Quality of Source Data. There were limitations regarding the data used in both corpora. In Corpus A, there were challenges associated with non-standardized abstracts. This is likely an anomaly related to the age of the information (60+ years old). As many journals move towards more standardized formats for abstracts and a greater emphasis is placed on accuracy in journal databases, this will become less of an issue. Also, due to the size of Corpus B, it was not possible to verify each title and abstract to ensure that information from the database was accurate and, during the title and abstract review phase, a number of minor errors were identified within the titles and abstracts. These are likely the result of human error during data entry on the Web of Science website. In larger data sets that rely on external databases, there invariably be the risk of errors appearing in the data. As such, researchers conducting using academic journals as a data source should be aware that this may be an issue and ensure appropriate data preprocessing occurs prior to analysis.
Selected Techniques. The literature notes that the decisions made by the researchers in terms of the data set, stop words, and questions posed will influence the results; similarly, the decision to focus on techniques that can be applied using the selected tools influenced the selection of the topic models. Popular analytical techniques such as log-likelihood could not be used with the selected tools; if they could be implemented, different topic models may have been generated.
Reviewer Expertise. Interpretation of the selected models relies on the knowledge of the researcher, as the expertise of the researcher enables effective identification of topic and word intrusion. As editors of Management Science, Shane and Ulrich are experts in their field; the depth of their expertise cannot be replicated by a graduate student. The results of this research should not be interpreted as an absolute description of the trends in Management Science, but as a starting point for a subsequent (manual) in-depth analysis, preferably by a subject-matter expert.
Conclusion
Lessons Learned
Benefits and Limitations of Topic Modeling. Topic modeling is a useful tool for analyzing vast amounts of textual data as it expedites the speed at which a researcher can identify topics for further evaluation and it removes reader bias that might otherwise interfere with the interpretation of a text (Blei and Lafferty, 2006; 2007; Gunther & Quandt, 2016). However, it should be approached with caution. Computers do not understand texts the way human coders can and are only as good as the algorithms they perform (Gunther & Quandt, 2016). While topic modeling forces a reviewer to consider semantically similar terms that they may not have otherwise considered, it can also shunt noisy data into uninterpretable topics in order to strengthen the coherence of topics that remain (DiMaggio et al., 2013). It remains up to the researchers to distinguish those topics that are useful from those that are not, based on their research questions. Techniques such as those proposed by Chang et al. (2009) can help humans to “read the tea leaves” by identifying word and topic intrusion; however, subject-matter expertise is no substitute for heuristics when evaluating the models.
Accuracy of Journal Databases. The assumption that the Web of Science database would be comprehensive and accurate was proven false. Several years of data were missing, limiting the researchers’ ability to generate several of the desired tables for comparison against Shane and Ulrich (2004). Additionally, while the selected tools were considerably more usable then the alternatives, there were several limitations (as identified in Chapter 6). With the limited documentation available online, there was a learning curve associated with the software; however, this was significantly lower than that of other topic modeling tools (R and MALLET). There remains a need for the developers to extend the software to allow individuals to save the topic models, word clouds, and perform initial analyses within Orange.
Usability vs. Analytic Tools. The heuristics that were identified during the literature review often focused on those which were easiest to implement using popular topic modeling tools (ex. R, MALLET). As noted in other literature, this does not always lead to cohesive topic models (Chang et al., 2009). While the use of a solution with a simple GUI helped enables the researcher to begin interacting with their data in a timely manner, there is a clear trade-off between usability and feature-completeness (i.e. Orange is currently missing additional diagnostic metrics). Once established, the process reduced the time to generate a topic model even when the corpus increased nearly tenfold; however, it was hampered by the lack of tools for analysis. A user that is confident using programs such as MALLET would have access to different tools; however, regardless of which program is used this remains a semi-automated – not automated – process. It is critical that researchers do not focus on quantitative heuristics that are “deceptively, seductively easy” (Jockers & Mimno, 2013: 767).
Value of the Research
The value of this research is not in replicating the work of Shane and Ulrich (2004) using semi-automated methods, the value is in the deltas between an expert manual review and a semi-automated review using topic modeling. These deltas include:
⦁ Environmental delta (tools used): Currently, researchers must have programming knowledge or be dedicated specialists, to conduct automated / semi-automated topic modeling. This research identifies how a topic modeling tool that has a clear graphical user interface (Orange) can be used in conjunction with a popular private-sector software application (Excel) to generate topic models. This enables individuals who are not computer scientists or dedicated specialists to leverage topic modeling. This contrasts with the current reliance open-source tools that require command-line programming experience, eliminates issues associated with relying on the open-source community to explain how to utilize these tools, and reduces the risk that as new versions of the tools are released the instructions become obsolete. In summary, this study provides non-programmers with access to topic modeling using tools that are well-established (Excel) and currently undergoing active development, but have an intuitive graphical user interface (Orange).
⦁ Process delta: This research presents a repeatable process – verified against a benchmark – that can be reproduced. Related to the environmental delta, the simplicity of the process in conjunction with the usability of the tools enables faster processing of larger data sets by users outside of computer science. It provides a straightforward approach using tools that are easy to learn, which will provide researchers with the opportunity to begin interacting with their data faster.
⦁ Results delta: The two topic models (Corpus A & B) provide additional insights regarding the topics contained within Management Science. Applying topic modeling to the original Management Science corpus (Corpus A) confirmed that the expert review was superior to using topic modeling software; however, the expert review is not a scalable approach to semantic data analysis. While probabilistic topic modeling prevents the exact reproduction of results, it is expected that if the process is reproduced, the resulting topic models related to Management Science will be substantially similar.
In summary, topic modeling expedites the review process for a large, text-based data sets; topic modeling software with a clear graphical user interface allows researchers to begin interacting with their data without requiring command line programming knowledge, thereby rendering it accessible to more researchers.
Future Work
Replicate method. It is hoped that future research attempts to replicate this process, both as it appears in this document as well as after any updated modules are added to the Orange software program. This would help determine if the heuristics can be further refined and the time required to generate a topic model further reduced. It would be worthwhile to compare topic modeling results when applying this method to a larger dataset that has an associated expert review. As the comparison was restricted to a relatively small data set (Corpus A: 248 articles), it is unclear whether similar alignment of topics would be observed in a larger data set (such as Corpus B).
Extend Analysis. The topic models generated from this work could also be used to further analyze the topics that are contained within the Management Science journal. While initial results were presented in this document, there are additional levels of analysis that could occur, including more detailed analysis of the evolution of the topics over time, as well as author-level analysis to identify the primary contributors to those topics, or the selection of a single topic for further analysis using topic modeling. If the latter option is selected, it would be advisable to compare the results to Corpus A to determine if the same variation regarding topic weights per year is observed. Finally, a comprehensive review including all articles from 1954-present using topic modeling would likely generate interesting results.
New Applications. While topic modeling has been used to identify topics in a corpus, there is very little discussion regarding the application of topic modeling to generate a literature review. This may be useful, as identifying topics is similar to identifying literature streams. As this could benefit researcher professionals and practitioners, determining whether topic modeling can be used for this application is suggested.
Improve Tools. The methodology and processed presented here can be used in other fields by non-technical individuals and individuals outside of the research community; however, the recommendation for improvements to the open-source software would greatly enhance the ability of non-technical researchers to utilized topic modeling. Additional reviews of the selected software using this process and confirmation of the suggestions for improvement would be beneficial for the developers and research community.
Summary
While the new insights regarding the evolution of topics in Management Science are interesting, the contribution is primarily around the semi-automated topic modeling process. The advantages and limitations of using the selected open-source tools and semi-automated methods, as compared to the baseline of a manual expert review, were identified and described. It was determined that the semi-automated process identified many of the same topics as the expert review; however, the benefits of the process were not realized until a larger corpus was reviewed. This reinforces the literature that indicates that the primary advantage of using topic modeling is to reduce the manual workload and eliminate bias, but that it cannot operate completely unsupervised. Therefore, while this semi-automated method extends topic modeling to a greater user community (both researchers and practitioners) the requirement for human interpretation will remain when using this technique.
References
Alvarez-Melis, D., and M. Saveski. 2016. Topic Modeling in Twitter: Aggregating Tweets by Conversations. Proceedings of the Tenth International AAAI Conference on Web and Social Media (ICWSM 2016), pp. 519–522. Palo Alto, California, Association for the Advancement of Artificial Intelligence.
Amin, M. 2016. A Topic Modeling Approach to Categorizing API Customer Value Propositions. (M. Weiss, Ed.). Masters of Applied Science (Technology Innovation Management), Carleton University.
Blei, D. M. 2012. Probabilistic topic models. Communications of the ACM, 55(4): 77–84.
Blei, D. M., & Lafferty, J. D. 2006. Dynamic Topic Models. Proceedings of the 23rd International Conference on Machine Learning, 113–120. New York, NY, USA: ACM.
Blei, D. M., & Lafferty, J. D. 2007. A correlated topic model of Science. The Annals of Applied Statistics, 1(1): 17–35.
Blei, D. M., Ng, A. Y., & Jordan, M. I. 2003. Latent Dirichlet Allocation. Journal of Machine Learning Research: JMLR, 3(Jan): 993–1022.
Box, G. E. P., & Draper, N. R. 1987. Empirical Model-building and Response Surface. New York, NY, USA: John Wiley & Sons, Inc.
Chang, H. C. 2016. The Synergy of Scientometric Analysis and Knowledge Mapping with Topic Models: Modelling the Development Trajectories of Information Security and Cyber-Security Research. Journal of Information & Knowledge Management, 15(04): 1650044.
Chang, J., & Blei, D. 2009. Relational topic models for document networks. Artificial Intelligence and Statistics.
Chang, J., Gerrish, S., Wang, C., Boyd-graber, J. L., & Blei, D. M. 2009. Reading Tea Leaves: How Humans Interpret Topic Models. In Y. Bengio, D. Schuurmans, J. D. Lafferty, C. K. I. Williams, & A. Culotta (Eds.), Advances in Neural Information Processing Systems 22: 288–296.
Choi, H. S., Lee, W. S., & Sohn, S. Y. 2017. Analyzing research trends in personal information privacy using topic modeling. Computers & Security, 67(Supplement C): 244–253
DiMaggio, P., Nag, M., & Blei, D. 2013. Exploiting affinities between topic modeling and the sociological perspective on culture: Application to newspaper coverage of U.S. government arts funding. Poetics, 41(6): 570–606.
Evans, M. S. 2014. A computational approach to qualitative analysis in large textual datasets. PloS One, 9(2): e87908.
Griffiths, T. L., & Steyvers, M. 2002. A probabilistic approach to semantic representation. Proceedings of the 24th Annual Conference of the Cognitive Science Society.
Griffiths, T. L., & Steyvers, M. 2003. Prediction and semantic association. Neural information processing systems 15. Cambridge, MA: MIT Press.
Griffiths, T. L., & Steyvers, M. 2004. Finding scientific topics. Proceedings of the National Academy of Science, 101, 5228-5235.
Griffiths, T. L., Steyvers, M., & Tenenbaum, J. B. 2007. Topics in semantic representation. Psychological Review, 114(2): 211–244.
Günther, E., & Quandt, T. 2016. Word Counts and Topic Models: Automated text analysis methods for digital journalism research. Digital Journalism, 4(1): 75–88.
Hofmann, T. 1999. Probabilistic Latent Semantic Indexing. Proceedings of the 22Nd Annual International ACM SIGIR Conference on Research and Development in Information Retrieval, 50–57. New York, NY, USA: ACM.
Hofmann, T. 2001. Unsupervised Learning by Probabilistic Latent Semantic Analysis. Machine Learning Journal, 42(1), 177-196.
Jockers, M. L., & Mimno, D. 2013. Significant themes in 19th-century literature. Poetics, 41(6): 750–769.
Jockers, M. L. 2013. 500 Themes from a corpus of 19th-Century Fiction. http://www.matthewjockers.net/macroanalysisbook/macro-themes/, January 5, 2018.
Koltsova, O., & Koltcov, S. 2013. Mapping the public agenda with topic modeling: The case of the Russian livejournal. Policy & Internet, 5(2): 207–227.
Konkasheva, E. 2017. Finding gaps in cybersecurity training curriculum. (M. Weiss, Ed.). Master of Engineering in Technology Innovation Management, Carleton University.
Mathew, G., Menzies, T., & Agrawal, A. 2016, August 29. Trends in Topics in Software Engineering. IEEE Transactions in Software Engineering.
Mimno, D. November 3, 2012. “Topic Modeling Workshop” [Video File] http://journalofdigitalhumanities.org/2-1/the-details-by-david-Mimno/, January 5, 2018.
Neuhaus, S., & Zimmermann, T. 2010. Security Trend Analysis with CVE Topic Models. 2010 IEEE 21st International Symposium on Software Reliability Engineering, 111–120.
Peskin, A., & Dima, A. 2017. Classification of Journal Articles in a Search for New Experimental Thermophysical Property Data: A Case Study. Integrating Materials and Manufacturing Innovation, 6(2): 187–196.
Rader, E., & Wash, R. 2015. Identifying patterns in informal sources of security information. Journal of Cybersecurity, 1(1): 121–144.
Shane, S. A., & Ulrich, K. T. 2004. Technological Innovation, Product Development, and Entrepreneurship in Management Science. Management Science, 50(2): 133–144.
Shane, S. A., & Ulrich, S. 2005. Online supplement to: Technological Innovation, Product Development, and Entrepreneurship in Management Science.
Song, M., & Ding, Y. 2014. Topic modeling: Measuring scholarly impact using a topical lens. In Measuring Scholarly Impact, pp. 235–257. Berlin: Springer International Publishing.
Steyvers, M., & Griffiths, T. 2007. Probabilistic topic models. In Handbook of Latent Semantic Analysis.
Tapelova, A. 2017. Analysis of Customer Perspective of Identity and Access Management solutions using Topic Modeling approach. (M. Weiss, Ed.). Master of Engineering in Technology Innovation Management, Carleton University.
Thelwall, M., & Thelwall, S. 2016. Development studies research 1975-2014 in academic journal articles: The end of economics? El Profesional de La Información, 25(1): 47–58.
Uys, J. W., Schutte, C. S., & Van Zyl, W. D. 2011. Trends in an International industrial engineering research journal: A textual information analysis perspective. Presented at the 41st International Conference on Computers & Industrial Engineering.
Wehrheim, L. 2017. Economic History Goes Digital: Topic Modeling the Journal of Economic History. In R. T. Riphahn (Ed.).
Wang, Y., Bowers, A.J., & Fikis, D.J. 2016. Automated Text Data Mining Analysis of Five Decades of Educational Leadership Research Literature: Probabilistic Topic Modeling of EAQ Articles From 1965 to 2014. Educational Administration Quarterly: EAQ, 53(2): 289–323.
Topic Modeling: A Hands-On Adventure in Big Data. n.d. The Historian’s Macroscope: Big Digital History. http://www.themacroscope.org/?page_id=788, August 16, 2017.
Annex A – Replicable Process
This section provides step-by-step instructions for generating a topic model using Orange and Excel. Information regarding initial data collection and associated challenges from the Web of Science database is described in Annex B. The list of stop words used is provided in Annex C.
Software Required:
⦁ Orange V3.8 and above (https://orange.biolab.si/download/)
⦁ Microsoft Excel (https://products.office.com/en-ca/excel)
Data Acquisition
Retrieve information from selected journal database, including: authors’ name, article publication year, title, abstract. Import into MS Excel and merge, removing excess columns and adding clear headers.
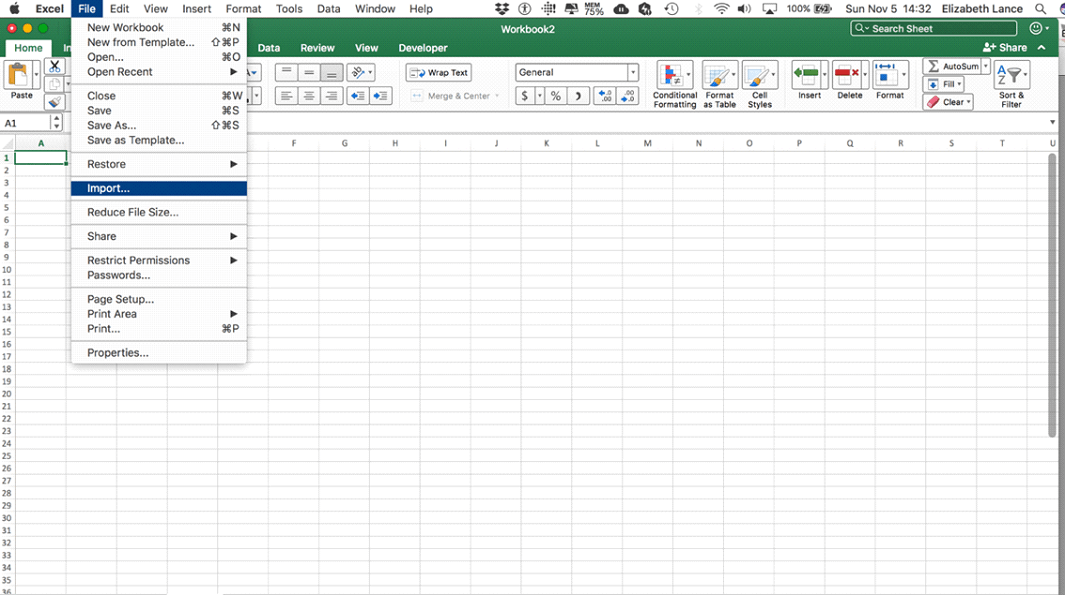
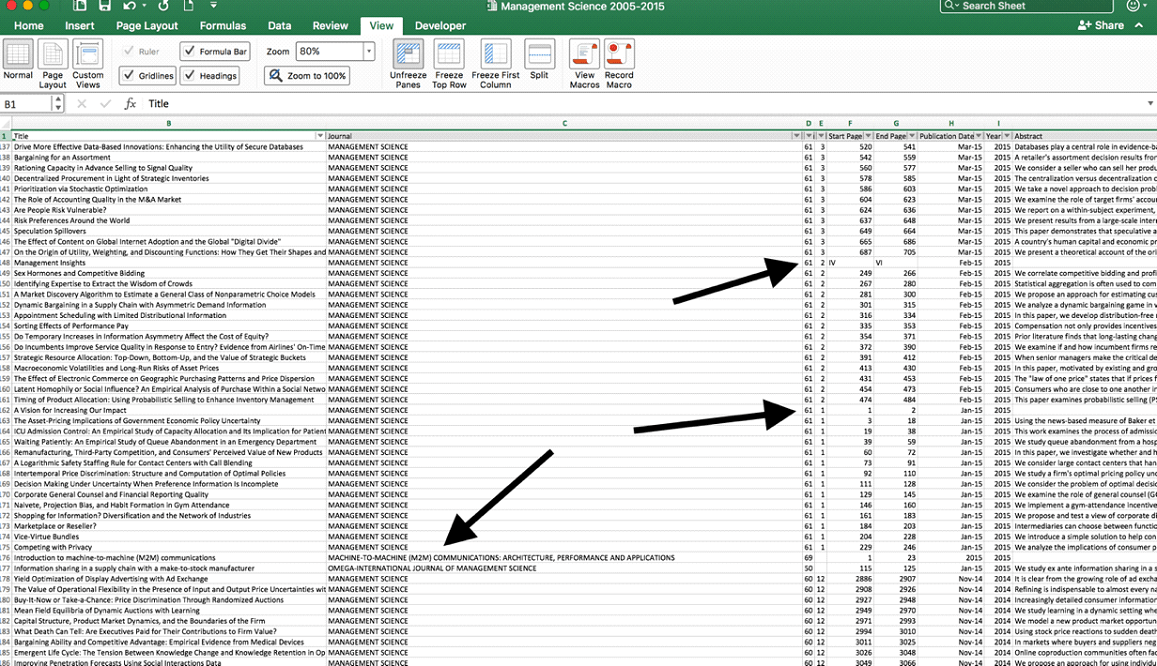

Data Preprocessing
Replicate workflow and preprocessing as per Figure 7-1 and Figure 7-2. (For stop words, see Annex C.) Standardize any terms that may be affected by the normalization process (ex. change “R&D” to “randd”).

Generation of Topic Models
⦁ Generate models for topic models at various increments (5, 10, 15 …etc.) by identifying the desired number of topics under the “Topic Modelling” module.
⦁ For each model:
⦁ Generate and save word clouds for each topic in each model.
⦁ Save outputs (Models, Words) as CSV files.
⦁ Save top 10 keywords for each topic model as a report.
⦁ Combine all Model CSV and Word CSV files into a single Excel file.
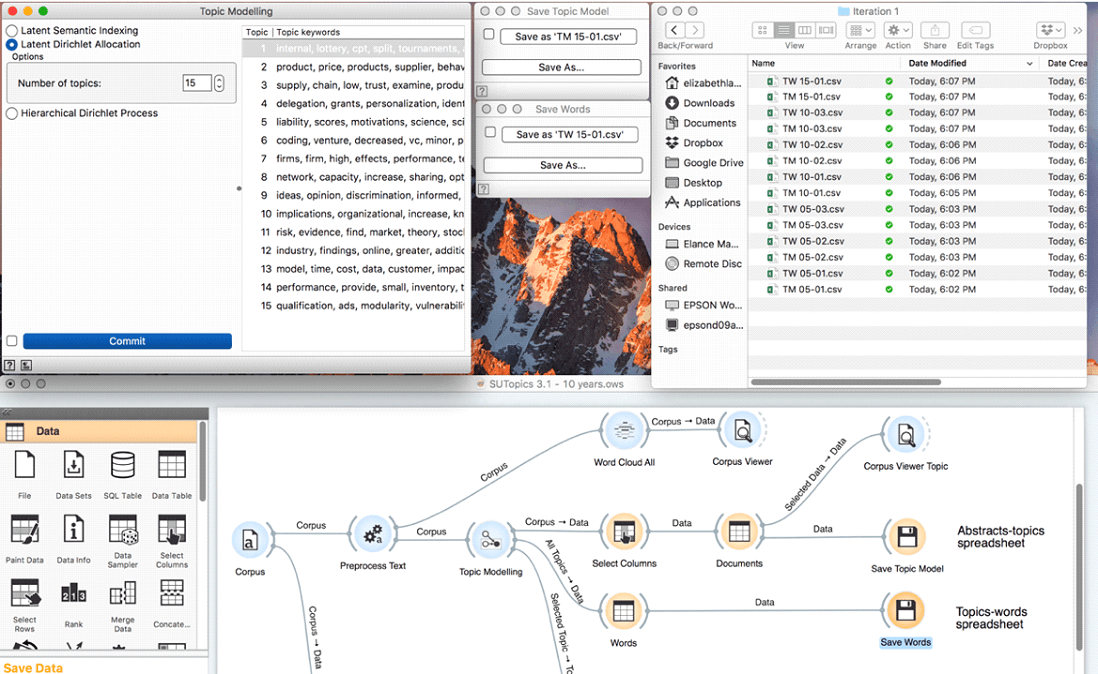
Selection of Optimal Topic Model
Since the purpose is to find the model with useful interpretation, the selection of the optimal model is inherently subjective as it is based on the researcher’s initial research questions and their ability to interpret the model. These heuristics may be used in conjunction with others.
Overall Importance of Topics
Calculate the overall importance of topics. On each sheet:
⦁ Determine the average weight of each topic (use =AVERAGE function in Excel at bottom of each column).
⦁ Sort topics left-to-right for highest-to-lowest average weight.
⦁ On a new sheet (“Summary”), import the top 10 keywords for each model. Create a column to identify the topic model (5, 10, 15 … etc.), topic number (assigned by Orange), topic weight (copied from individual sheets, transposed as required).
⦁ In a new column, identify the topics that represent 90% of papers for each model (use highlight feature in Excel).
⦁ Create a pivot table (Data -> Summarize with Pivot Table) that identifies the number of topics per model that represented the top 90% of topics. Save on a new sheet (“90%”).
⦁ Generate charts to visualize the summarized results from the pivot tables (Insert -> Chart).

Coherence
(Note: In the previous step, all the topics that represent less than 10% of the total topics within a given topic model should be removed from future analysis using the filter functionality in Excel.)
Coherence is determined by conducting the following steps:
⦁ On the “Summary” sheet, review the keywords for the topics that are included in the top 90% of each topic model for coherence.
⦁ In a new column, manually assign a score of high, medium, or low cohesion in a separate column.
⦁ Create a pivot table that identified the number of topics per model and counted the coherence labels of high, medium, or low cohesion. Save on a new sheet (“Coherence”).
⦁ Generate charts to visualize the summarized results from the pivot table.
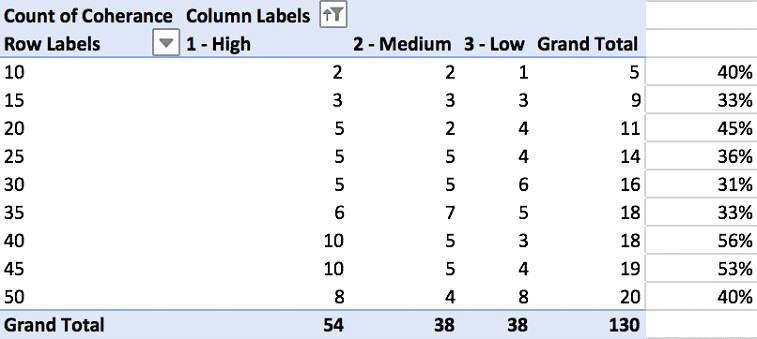
Duplicate / Recurring Topics
⦁ In a new column, create a formula in Excel to show only the first 2-4 words for each topic label and added a column where the number of words to include is identified:
⦁ =TRIM(LEFT(SUBSTITUTE(E2,” “,REPT(” “,1000),R2),1000)), where E2 is the cell containing text to be trimmed and R2 is the cell that identifies how many words to include.
⦁ Generate pivot tables and charts to identify # of identical topics for 3, 4, and 5 words.
⦁ Generate pivot table and chart to identify model containing most duplicate topics.
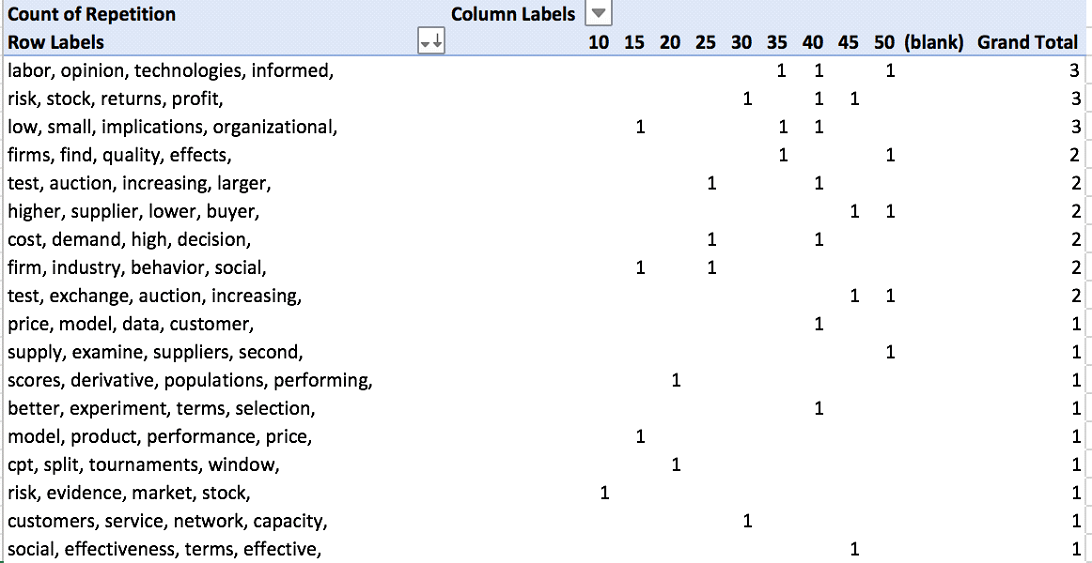
Select topic model based on review of current and previous heuristics. Proceed to labeling of topics in topic model.
Labeling Topics (Initial Interpretation)
This section assumes that a topic model has been selected. It discusses initial interpretation of the results.
Topic Headwords
⦁ Organize the topics in terms of topic weight from highest to lowest (top to bottom). Insert column and number [1…n].
⦁ Use the TRIM formula in Excel to show only the first 2-4 words for each topic labelled as “High” or “Medium” coherence.
⦁ Review automatically generated labels. Adjust for ease of reading (as required).
Word Clouds
⦁ Review word clouds associated with each topic to determine if the topic labels can be further refined, based on context. (Larger terms have higher weights within the topic.)
⦁ Adjust topic labels as required.

Review of Abstracts and Titles
⦁ In the sheet for the selected topic model, insert two new columns: Highest Weight and Second Highest Weight.
⦁ Use the INDEX function of Excel to identify the topic with the highest weight across all topics in the topic model. =INDEX($A$1:$AN$1,0,MATCH(LARGE($A2:$AN2,1),$A2:$AN2,0))
⦁ Use the INDEX function of excel to identify the topic with the second-highest weight across all topics in the topic model.
=INDEX($A$1:$AN$1,0,MATCH(LARGE($A2:$AN2,2),$A2:$AN2,0))
⦁ Generate a pivot table that identifies the number of articles associated with the highest topic for each article.
⦁ In the original spreadsheet, use the Sort & Filter functionality to identify highest-weighted articles in each topic.
⦁ Review titles & abstracts for articles for top ~10% of highest weighted articles for each topic (more if the count is less than 10 articles). If required, adjusted “Highest Weight” manually so article is associated with in a new column.
⦁ Adjust topic labels as required.
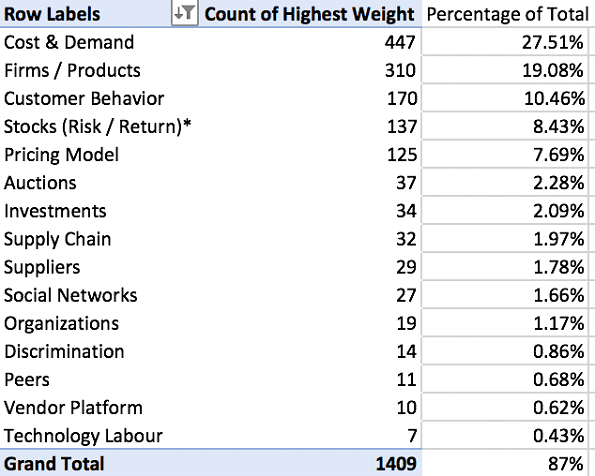
Figure – Pivot Table To Identify Total Articles Per Topic (Example)
Final Topic Model: Description and Visualization
After selection and verification of the model, generate a final list of topics and their interpretation based on the word clouds, article titles / abstracts reviews.
Visualization: Distribution of Articles Across Topics By Year
⦁ If it does not already appear in the topic model spreadsheet, add information regarding publication year for each article.
⦁ Create a pivot table identifying the publications per topic, per year.
⦁ Highlight and create a chart based on the pivot table. Adjust as required.
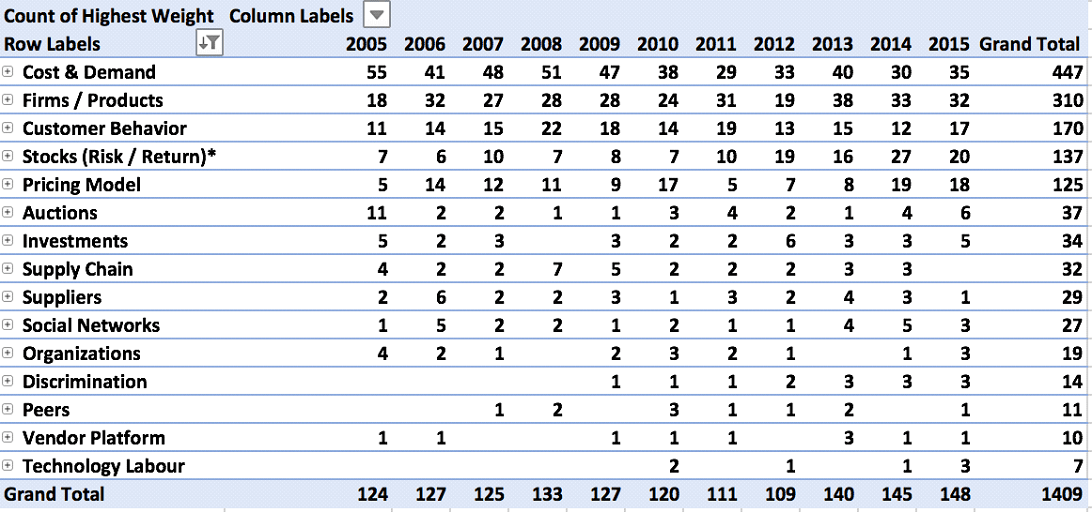
Visualization: Evolution of Topics Over Time
⦁ If not in the topic model spreadsheet, add information regarding publication year.
⦁ Create a pivot table identifying the average weight of each topic, per year.
⦁ Create a chart based on the pivot table. Adjust as required.
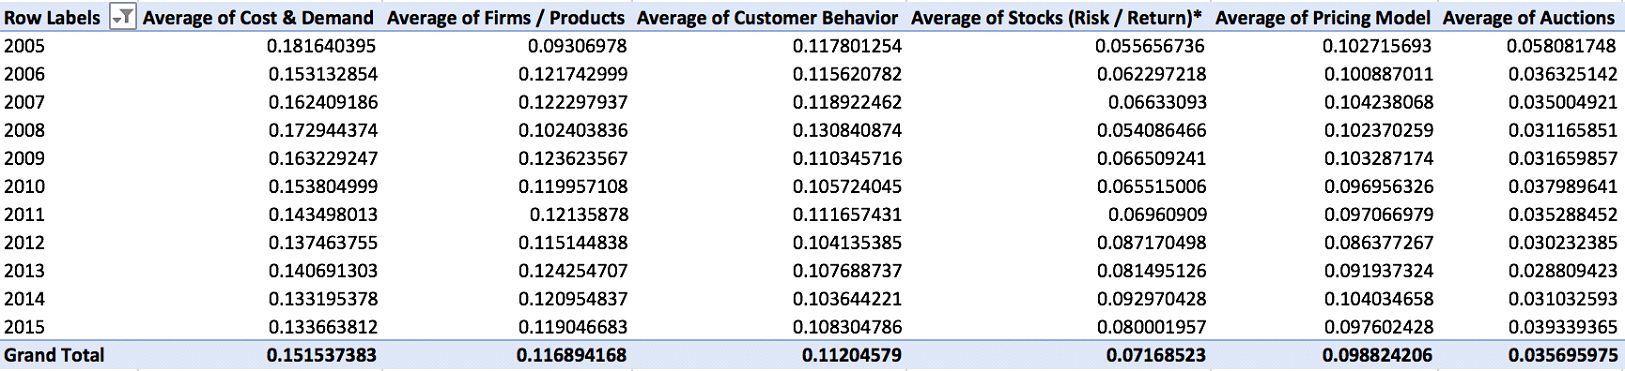
Annex B – Data Acquisition (Web of Science)
Process
Manually selected all results on each page and selected “Add to Marked List”
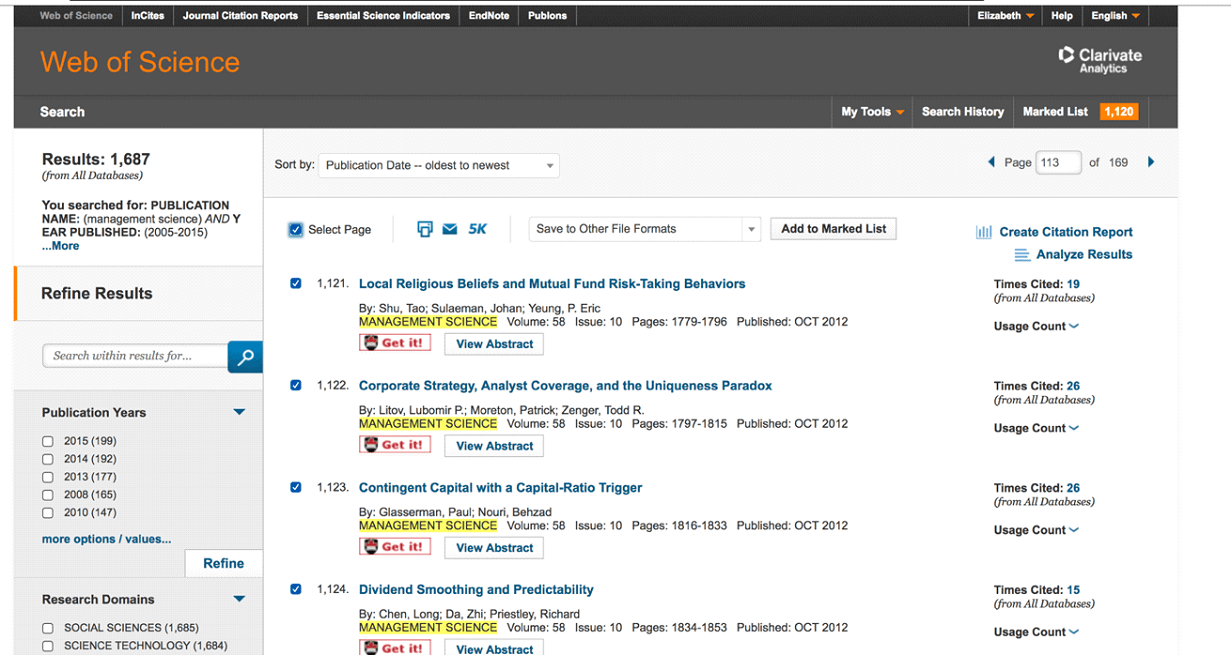
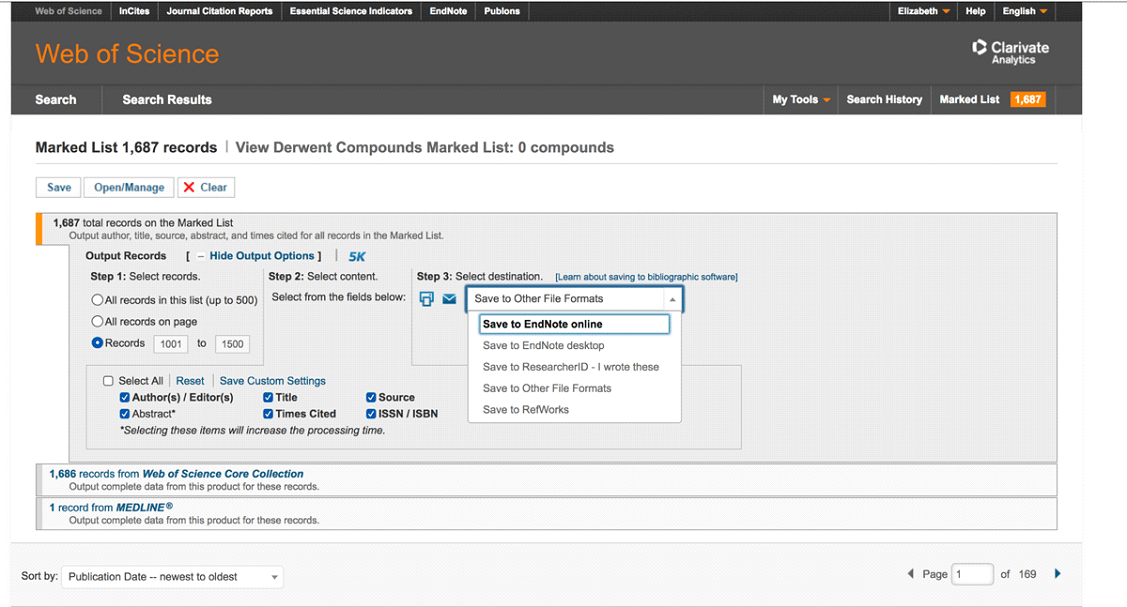
In Marked List, selected maximum number of records (500 records). Ensured the “Abstract” box was checked. Downloaded in Tab-delimited format (MAC, UTF-8).
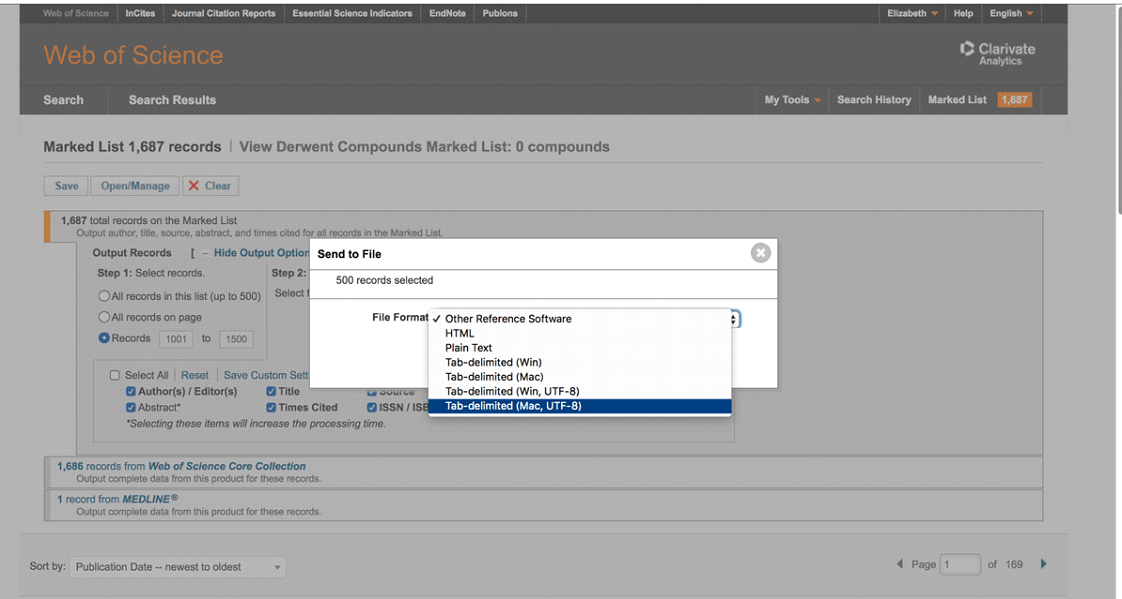
Annex C – Stop words
Initial List
The initial list of stop words was selected from a website dedicated to improving webs searchers (Ranks.NL). The complete list of stop words is available here:
https://www.ranks.nl/stopwords
Corpus-specific terms
A number of corpus-specific terms were identified after initial testing. These included:
| paper | papers |
| article | research |
| researchers | study |
| analysis | results |
| problem | problems |
| approach | approaches |
| method | methods |
| models | techniques |
| examples | way |
| ways | order |
| work | body |
| analyses | kind |
| notion | basis |
| co | lu |
| best | fmea |
| npps | fields |
| thesis | cidis |
| tss | cdtp |
| qualitative | quantitative |
| france | italy |
| japan | united |
| kingdom | ussr |
| west | germany |
| united states | eastern |
| western | europe |
| european | israel |
| hong | kong |
| great | britain |
| afghanistan | hamburg |
| Japanese |